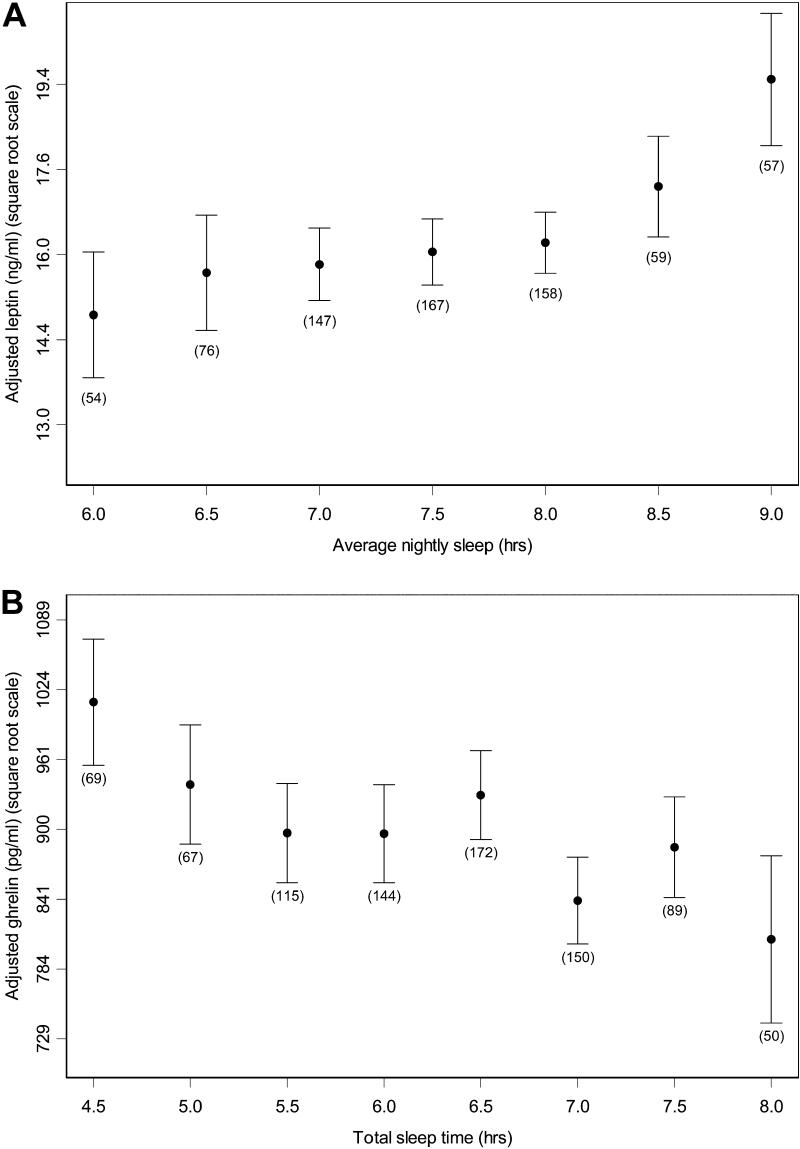
Figure 3. The Association between Sleep Duration and Serum Leptin and Ghrelin Levels.
(A) Mean leptin levels and standard errors for half-hour increments of average nightly sleep after adjustment for age, sex, BMI, and time of storage (see Table 2). Average nightly sleep values outside the lowest and highest intervals are included in those categories. Sample sizes are given below the standard error bars. The y-axis uses a square-root scale. Data derived from 718 diaries because three participants had missing leptin data.
(B) Mean ghrelin levels and standard errors for half-hour increments of total sleep time after adjustment for age, sex, BMI, and time of storage (see Table 2). Total sleep time values outside the lowest and highest intervals are included in those categories. The y-axis uses a square-root scale. Note that ranges for total sleep time amounts are typically shorter than those for average nightly sleep amounts (A; see Figure 1), and do not correlate strongly (see text).

