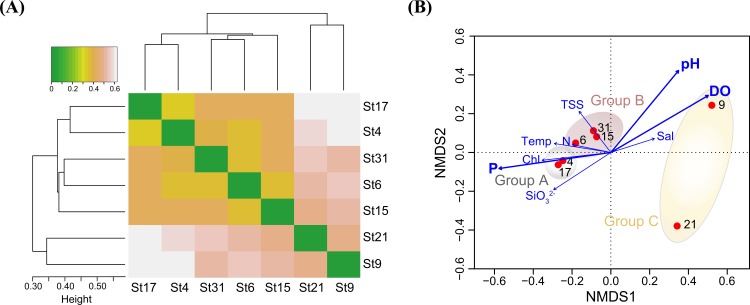
Fig 4. Clustering analysis based on OTUs of 7 seawater samples.
(A) Dendrogram and heat map based on Bray-Curtis distances showing the clustering of bacterial community of sampling stations, (B) A non-metric multidimensional scaling plot showing the relationships among sampling stations. Correlations between environmental variables and the first two dimension axes are represented by the arrows, and variables showing significant correlation (p < 0.05) are indicated in bold. Temp, temperature; Sal, salinity; DO, dissolved oxygen; TSS, total suspended solids; P, phosphate; N, dissolved inorganic nitrogen; Chl, chlorophyll a.

