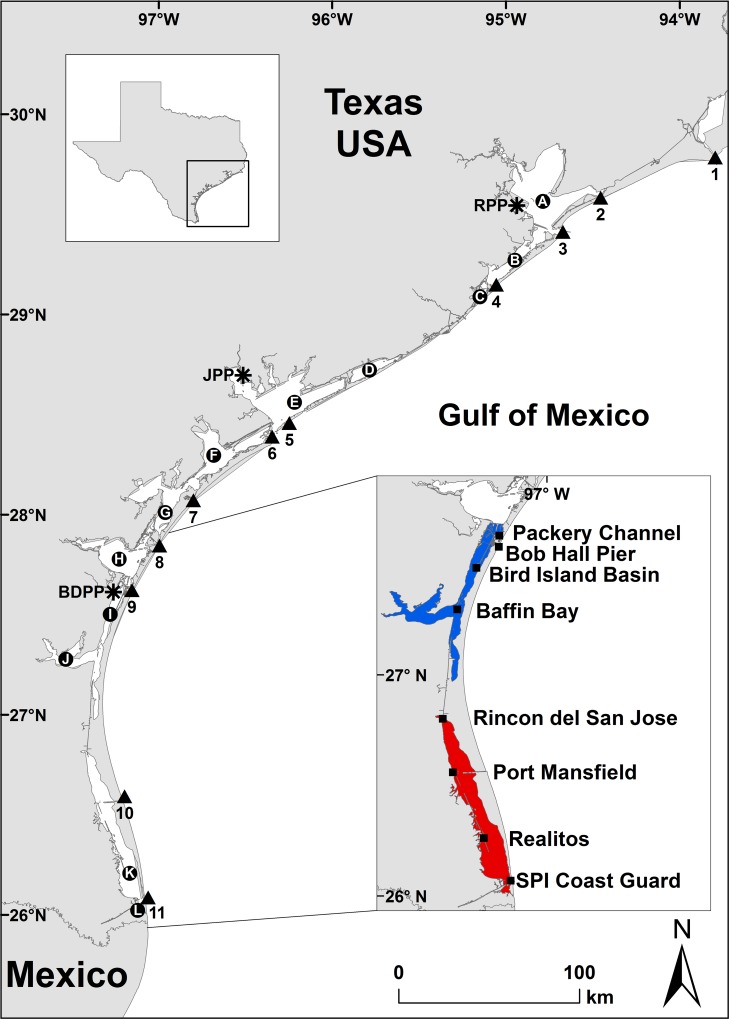
Fig 1. Map of Texas coast with numbers representing the 12 lettered bays systems (circles), 11 numbered channels and passes (triangles), 3 power plants (asterisks), and insert map of 8 National Water Level Observation Network (NWLON) and Texas Coastal Ocean Observation Network (TCOON) environmental monitoring stations (squares) along the Upper Laguna Madre (blue) and Lower Laguna Madre (red) of South Texas.
The 12 bays are arranged from north to south: A = Galveston Bay, B = West Bay, C = Christmas Bay, D = East Matagorda Bay, E = Matagorda Bay, F = San Luis Bay, G = Aransas Bay, H = Corpus Christi Bay, I = Upper Laguna Madre, J = Baffin Bay, K = Lower Laguna Madre, and L = South Bay. The 11 channels and passes are arranged from north to south: 1 = Sabine Pass, 2 = Rollover Pass, 3 = Bolivar Roads Channel, 4 = San Luis Pass, 5 = Matagorda Ship Channel, 6 = Pass Cavallo, 7 = Cedar Bayou Pass, 8 = Aransas Pass Ship Channel, 9 = Packery Channel, 10 = Mansfield Channel, and 11 = Brazos Santiago Pass. The 3 power plants are arranged from north to south: RPP = PH Robinson Power Plant, JPP = Joslin Power Plant, and BDPP = Barney Davis Power Plant. The eight stations are arranged from north to south: Packery Channel, Bob Hall Pier (NWLON), Bird Island Basin, Baffin Bay, Rincon del San Jose, Port Mansfield, Realitos and South Padre Island (SPI) Coast Guard. (TIF)

