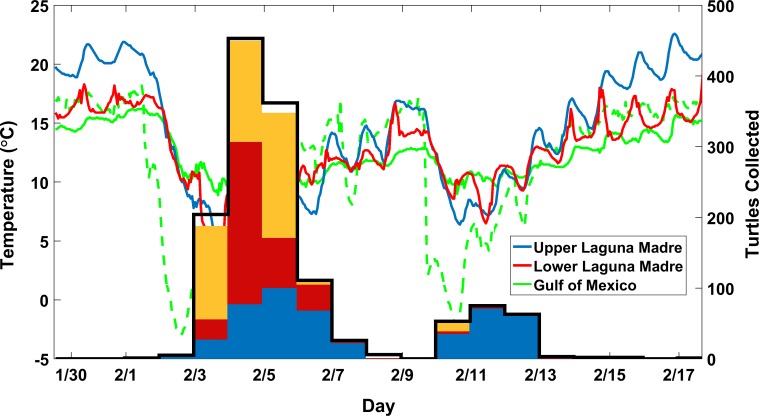
Fig 5. Water temperatures at different locations of the study area (full lines) and air temperature at Bob Hall Pier (dashed line) during the period 30 January to 17 February 2011 (UTC), including two of the largest hypothermic stunning events (1–8 February and 10–17 February) of the study period.
Water and air temperatures two days prior to the first event were included for comparison. The bars indicate the chronology of the hypothermic stunned turtles recorded in the Upper Laguna Madre (blue), Lower Laguna Madre (red), Brazos Santiago Pass (orange) and rest of the study area (white).

