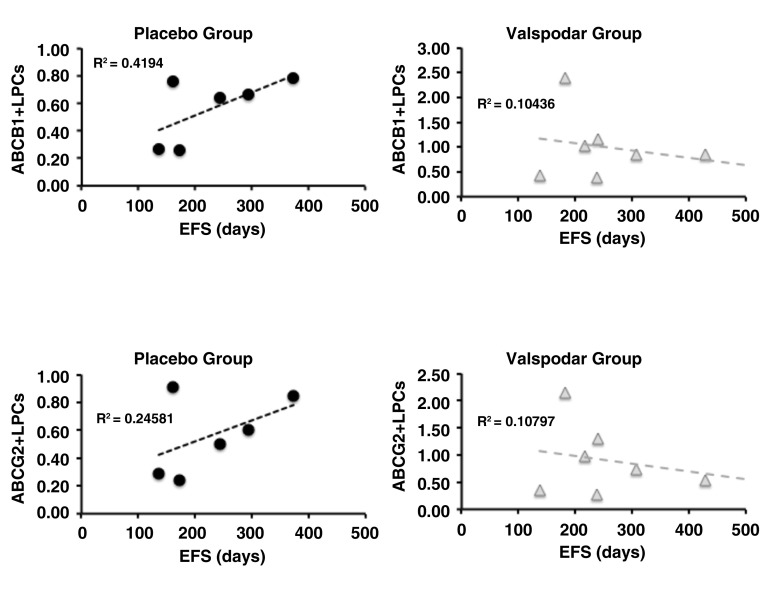
Figure 4. Event-free survival of dogs as a function of ABCB1 and ABCG2 expression in lymph node LPCs from dogs with large B-cell lymphoma at diagnosis.
Dot plots showing the relationship between ABCB1 expression and event-free survival (EFS) in days (top) and between ABCG2 expression and EFS in days (bottom) in dogs treated with placebo (N = 9) or with neoadjuvant valspodar (N = 9) where samples were available for these measurements. The dashed lines represent linear regressions and their R 2 values are indicated on each graph. The Y-axis represents the % of ABC +/Progenitor +lymph node B cells. Data were analyzed and graphs were assembled using MS Excel.

