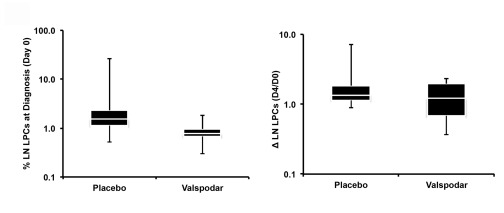
Figure 3. LPCs in lymph nodes from dogs with large B-cell lymphoma at diagnosis and on the fourth day of neoadjuvant treatment with valspodar.
Left: Box plots showing median (white line), 75% confidence intervals, and outliers of the percent LPCs in lymph nodes at diagnosis, and Right: relative change in LPCs from the time of diagnosis (Day 0) to the fourth day of the neoadjuvant period (Day 4) in each group of dogs. A ΔLPC = 1.0 means no change in the percent LPCs measured at both time points. Data were analyzed and graphs were assembled using MS Excel.

