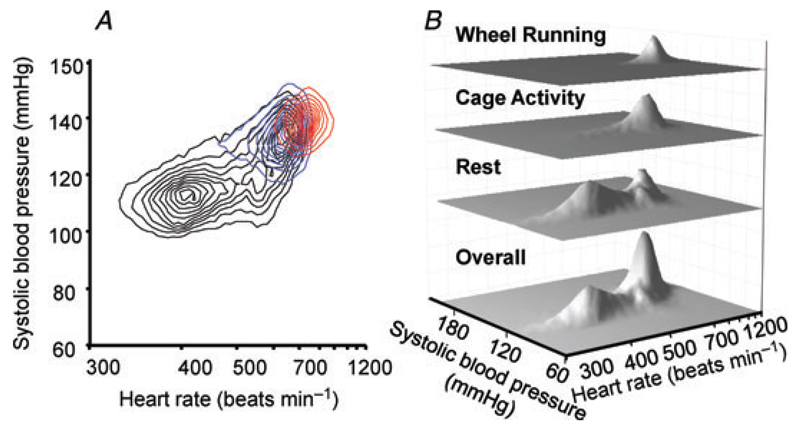
Figure 1. Typical example of distribution for systolic blood pressure and heart rate over a 24 h period in a single mouse.
A, contour plot showing haemodynamic distribution at rest (black contours), during cage activity (blue) and during wheel running (red). B, three-dimensional interval histogram showing distribution of haemodynamic parameters overall, at rest, during cage activity and during wheel running. The lower rest mode occurs at 115 mmHg and 400 beats min−1 in this example, the cage activity mode at 135 mmHg and 650 beats min−1 and the wheel running mode at 140 mmHg and 730 beats min−1. There is also a second resting peak, coinciding exactly with the cage activity peak.

