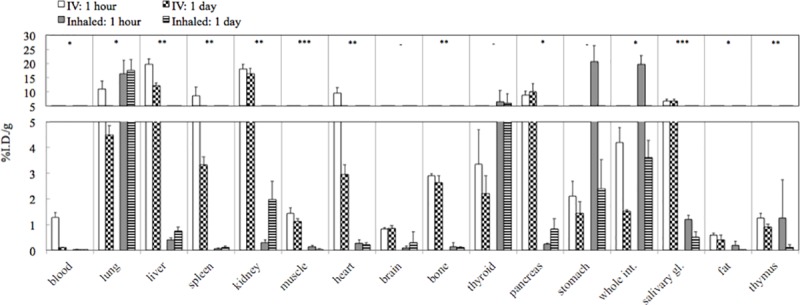
Fig 1. Plot showing results from ex vivo biodistribution of saline solutions containing 52Mn administered via intravenous injection or inhalation.

The timepoints shown represent the time after administration of the dose. Results for the p-values from Student’s t-test with Welch’s correction at 1 d p.i. only: *: p<5%; **: p<0.1%; ***: p<0.01%; -: p≥5%. Sample sizes for each timepoint were n = 4 mice for injection and n = 3 for inhalation. Uncertainties: one absolute standard deviation in units of %ID/g. Error bars were only drawn in the positive direction for visual clarity. The plotted data is presented in numerical form in Table 1.
