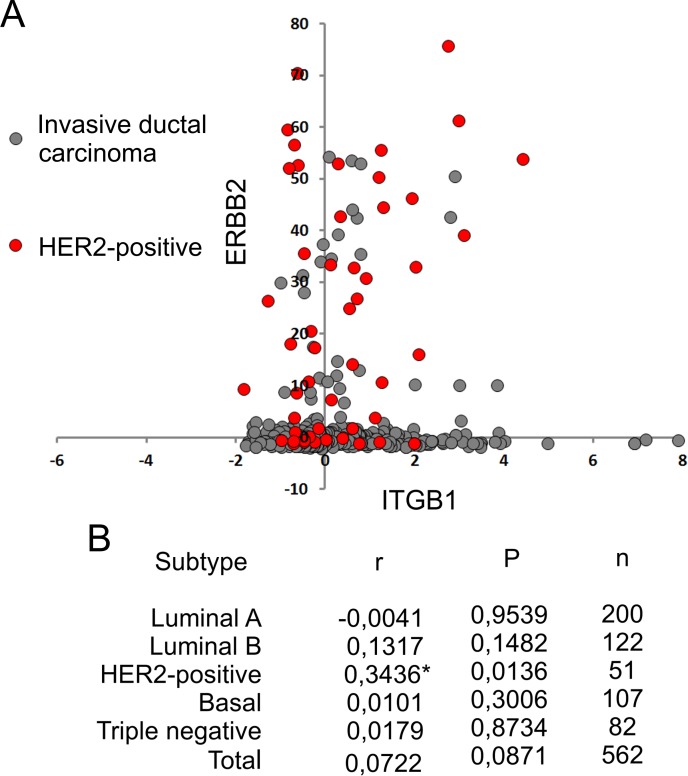
Fig 4. Coexpression of ErbB2 and beta1 integrin in breast cancer.
(A) Dot-plot of mRNA expression Z-Scores for breast cancer samples published by TCGA in 2015 [60] with PAM50 characterization (black dots) and HER2-positive tumors (red dots). (B) Pearson´s correlation coefficient (r), two-tailed P value (P) and number of samples (n) for different invasive ductal carcinomas subtypes. *r values regarded as significant correlation (alpha = 0.05).

