Figure 4.
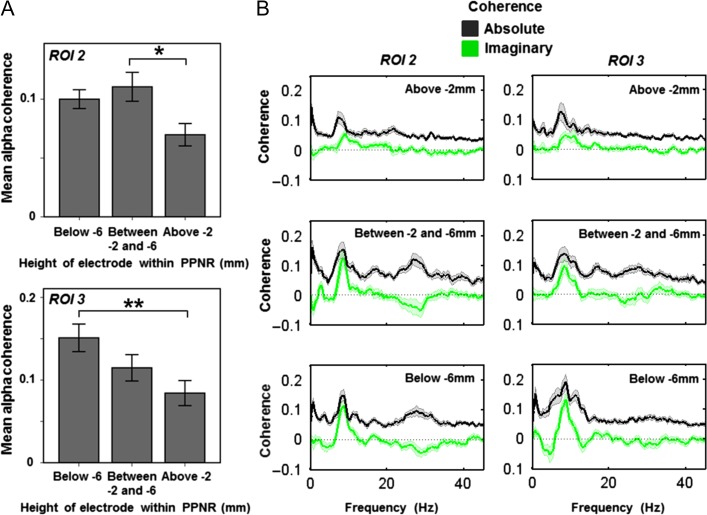
Alpha coherence varies within the PPNR. Source activity was extracted from the peak voxel of alpha coherence, taken from ROI 1 (subgenual cingulate), ROI 2 (posterior midcingulate) and ROI 3 (brainstem, maximal in dorsal pons). For each ROI, mean alpha coherence was then calculated and the resulting values were subjected to a mixed-effects ANOVA, with subject as a random factor, and dopamine (ON vs. OFF) and electrode height as factors of interest. Electrode height within the PPNR was split into three groups (above −2 mm termed the upper PPNR (including the rostral PPN); −2 to −6 mm termed the middle PPNR (including the caudal PPN); and below −6 mm termed the lower PPNR (including the region below the caudal PPN). The main effect of height was significant for PPNR coherence with ROIs 2 (A Top) and 3 (A Bottom) but not for ROI 1 (data not shown). A Top: post hoc t-tests showed that coherence with ROI 2 was higher in the middle PPNR (between −2 mm and −6 mm) than the upper part above −2 mm (P = 0.012) and A Bottom: coherence with ROI 3 was higher in the lower PPNR (below −6 mm) than the upper PPNR above −2 mm (P = 0.008). Error bars represent SEM. The coherence spectra at each height are shown in B. Data are shown as mean (heavy line) and SEM (lighter shaded area). Absolute coherence is shown in black and is maximal in the middle PPNR with ROI 2 and the lower PPNR with ROI 3. To investigate whether coherence represents spurious volume conduction, we also calculated imaginary coherence spectra which are shown in green. Imaginary coherence is maximal in the same regions as absolute coherence suggesting that these are not spurious findings. Note that peak coherence shown in B is slightly higher than mean coherence across the alpha band shown in A.

