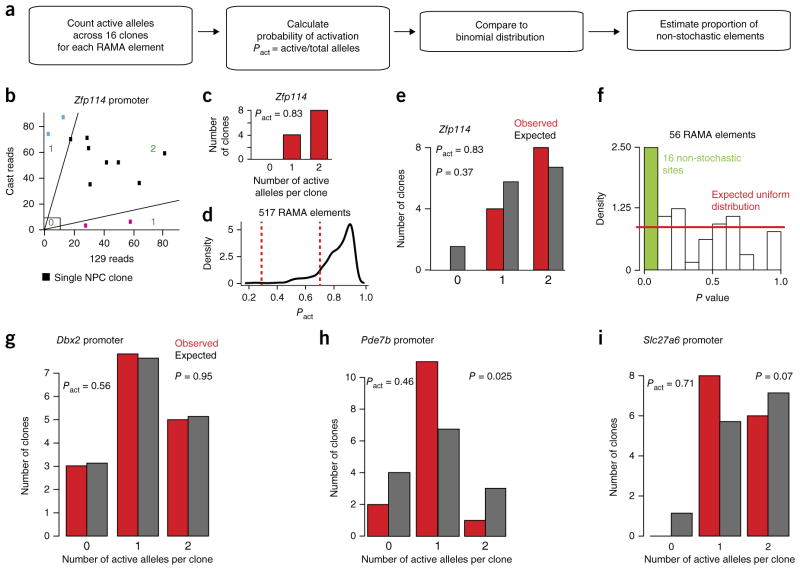
Figure 6.
Establishment of some RAMA elements cannot be explained by a stochastic model. (a) Description of the method for testing whether the distribution of 0, 1 or 2 accessible alleles in ATAC–seq data across 16 NPC clones deviates from the binomial. (b) Spectrum of active alleles at the Zfp114 promoter locus. Blue and pink clones are monoallelic and considered ‘1’. Black clones are biallelic and were either accessible or closed on both alleles (‘2’ or ‘0’). (c) The number of 0, 1 and 2 alleles across 16 clones at the Zfp114 promoter. (d) Distribution of Pact for RAMA elements. Elements with Pact between 0.3 and 0.7 (between dashed red lines) were considered for analysis in f. (e) Comparison of the distribution of 0, 1 or 2 accessible alleles at the Zfp114 promoter locus to the binomial based on Pact = 0.83. (f) Estimate of the percentage of RAMA elements whose distribution of active alleles deviates significantly from the expected binomial distribution based on random activation. The plot shows the distribution of P values for 56 RAMA elements with probabilities of activation between 0.3 and 0.7. The red line corresponds to the expected uniform distribution, and the green bar indicates elements whose P values are significant. (g) Example of a RAMA element at the Dbx2 promoter showing a random distribution of 0, 1 and 2 alleles. (h) The RAMA element in the Pde7b promoter had a higher number of clones with 1 active allele then expected. (i) The RAMA element in the Slc27a6 promoter had a lower number of clones with 0 active alleles than expected.

