. 2017 Feb 8;6:e23268. doi: 10.7554/eLife.23268

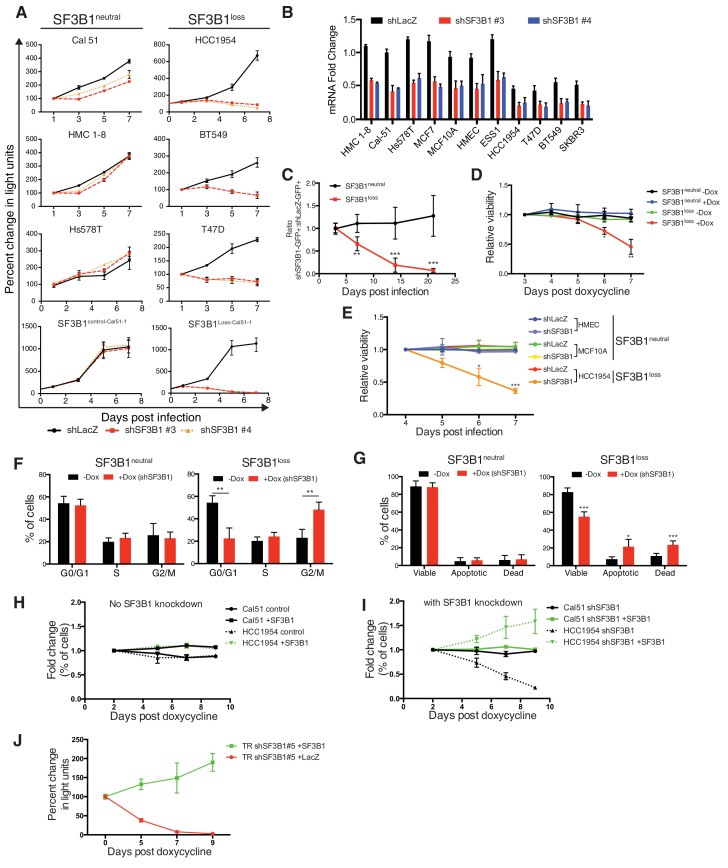
Figure 2. Characterization of SF3B1 as a CYCLOPS gene.

(A) Growth of breast cancer cell lines expressing shLacZ (black) or shSF3B1 (red and orange), measured as changes in CellTiterGlo luminescence relative to one day post-infection. (B) Quantitative RT-PCR of SF3B1 expression from the indicated cell lines expressing shLacZ or shSF3B1 shRNAs normalized to the diploid SF3B1neutral cell line Cal51. (C) Ratio of cells expressing shSF3B1-GFP relative to uninfected controls, normalized to the ratio of cells expressing shLacZ-GFP relative to uninfected controls. Data represent averages from SF3B1neutral (n = 7) and SF3B1loss (n = 6) cell lines, using shSF3B1 #4 in Figure 2—figure supplement 2E. (D) Viability of cells expressing TR-shSF3B1#3 and TRshSF3B1#5, relative to viability three days post doxycycline administration. (E) Viability of cells expressing shLacZ or the average of shSF3B1#3 and shSF3B1#4, measured asthe fraction of propidium iodide negative cells, relative to the viability of these cells four days post infection. (F) Cell cycle distribution four days after SF3B1 suppression averaged from TR shSF3B1#3 and #5. (G) Fraction of apoptotic cells five days after SF3B1 suppression averaged from TR shSF3B1#3 and #5, as determined by AnnexinV/PI flow cytometry. (H) Change in ratio of cells expressing SF3B1-GFP relative to uninfected cells. (I) Ratio of cells expressing SF3B1-GFP to uninfected cells, in the context of endogenous SF3B1 suppression with TR-shSF3B1 #5. (J) Growth of LacZ and SF3B1 expressing SF3B1loss cells upon SF3B1 suppression (TR-shSF3B1#5), measured as changes in CellTiter-Glo luminescence. For all panels, *p<0.05 **p<0.01 ***p<0.001, and error bars represent ± SD from at least three (panels AG) or two (H–J) replicates.

DOI: http://dx.doi.org/10.7554/eLife.23268.004

Figure 2.

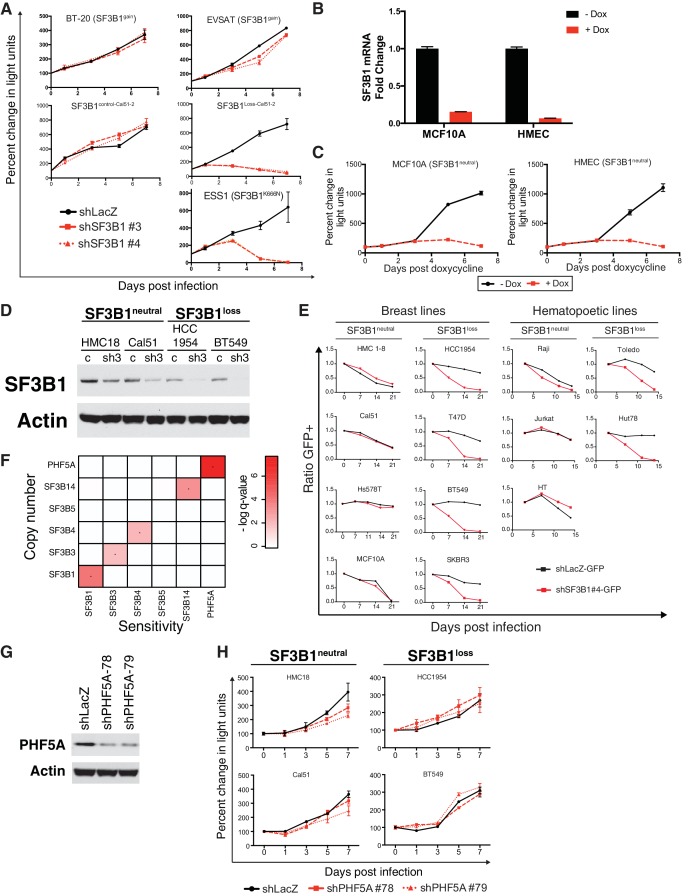
Figure 2—figure supplement 1. Characterization of SF3B1 as a CYCLOPS gene.

Figure 2—figure supplement 1.

(A) Growth of SF3B1gain, SF3B1control-Cal51-2 and SF3B1Loss-Cal51-2, and SF3B1K666N mutant cells (measured as change in light units; Figure 2A) after infection with shRNAs targeting LacZ or SF3B1. (B) Quantitative RT-PCR of SF3B1 expression without (black) or with (red) doxycycline-induced shSF3B1 expression using TR-shSF3B1 #5 demonstrating greater than 85% knockdown. (C) Growth of non-transformed SF3B1neutral cell lines without (black) or with (red) doxycycline-induced shSF3B1 expression using TR-shSF3B1 #5. Growth curves are measured as changes in CellTiterGlo luminescence relative to day 0 of doxycycline treatment. (D) SF3B1 immunoblot from SF3B1neutral and SF3B1loss cells expressing shLacZ (c) or shSF3B1#3 (sh3) hairpins performed in parallel to growth assays in Figure 2A. (E) Ratio of GFP-expressing cells to uninfected controls in SF3B1neutral and SF3B1loss breast and hematopoietic cell lines expressing shLacZ-GFP (black) or shSF3B1#4-GFP (red). (F) Heatmap of False Discovery Rate q-values indicating the significance of associations between copy numbers of SF3b complex members (rows) and sensitivity of those cells to suppression of SF3b complex members by shRNA (columns). (G) PHF5A immunoblot three days after infection with shLacZ or shPHF5A targeting hairpins from HCC1954 cells profiled in panel Figure 2—figure supplement 1G. (H) Growth of breast cancer cell lines expressing shLacZ (black) or shPHF5A (red), measured as changes in CellTiterGlo luminescence relative the day of infection. For all panels, error bars represent ± SD from at least three technical replicates.
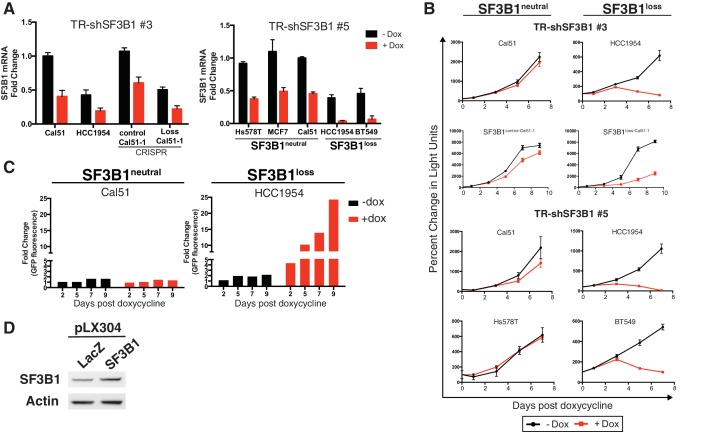
Figure 2—figure supplement 2. Further characterization of SF3B1 as a CYCLOPS gene.

Figure 2—figure supplement 2.

(A) Quantitative RT-PCR of SF3B1 expression without (black) or with (red) doxycycline-induced shSF3B1 expression relative to the diploid cell line Cal 51. (B) Growth of breast cancer cell lines without (black) or with (red) doxycycline-induced shSF3B1 expression, measured as changes in CellTiterGlo luminescence relative to day 0 of doxycycline treatment. (C) GFP fluorescence from cells expressing SF3B1-IRES-GFP without (black) or with (red) doxycycline-induced TR-shSF3B1#5 expression. (D) SF3B1 immunoblot from HCC1954 cells expressing LacZ or SF3B1. For all panels, error bars represent ± SD.