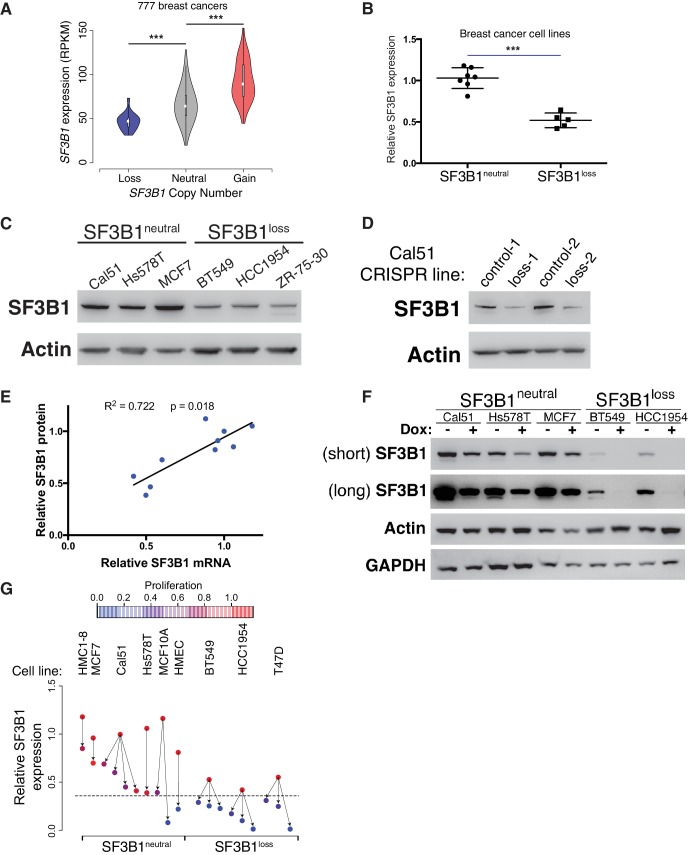
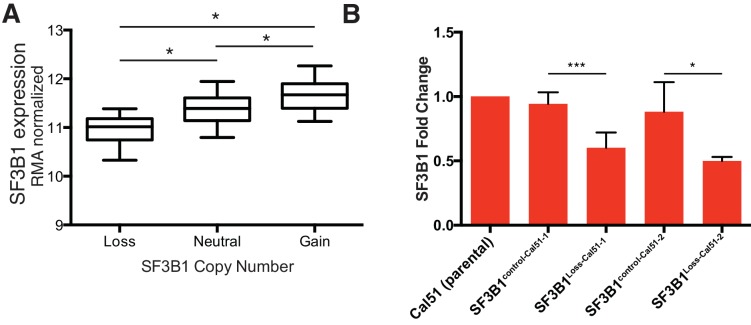
Figure 3. SF3B1neutral cells contain excess SF3B1 beyond the requirement for survival.
(A) SF3B1 expression from 777 TCGA breast adenocarcinomas segregated by SF3B1 copy number. Whiskers represent min/max values and boxes represent upper and lower quartile ranges. Width of plots represents relative sample density. (B) Quantitative RT-PCR of SF3B1 expression in breast cancer cell lines. Data points represent individual cell lines, horizontal lines indicate means. (C) SF3B1 protein levels in breast cancer cell lines by immunoblot. (D) SF3B1 immunoblot from control cells and those with single-copy SF3B1 inactivation by CRISPR. (E) Scatterplot of SF3B1 mRNA and protein expression relative to diploid cell line Cal51 after normalization to actin in a panel of breast cancer cell lines (p=0.0018, R2 = 0.772, regression line slope = 0.789). (F) SF3B1 immunoblot from SF3B1neutral and SF3B1loss cells 4 days after TR-shSF3B1#5 induction by doxycycline. (G) Differences in proliferation 7 days after SF3B1 suppression (per CellTiter-Glo, see Appendix Methods; red=high, blue=low), against the relative level of SF3B1 expression (assessed by qPCR; y-axis) in SF3B1neutral (left) or SF3B1loss (right) cells expressing either shLacZ (origins of arrows) or shSF3B1 (ends of arrows). Origins with multiple arrows represent cell lines subject to more than one SF3B1 shRNA. Each data point represents the mean from at least two replicate experiments. The dashed line represents the estimated minimum threshold of SF3B1 expression required for survival. For all panels, *p<0.05 **p<0.01 ***p<0.001, and error bars represent ± SD.


