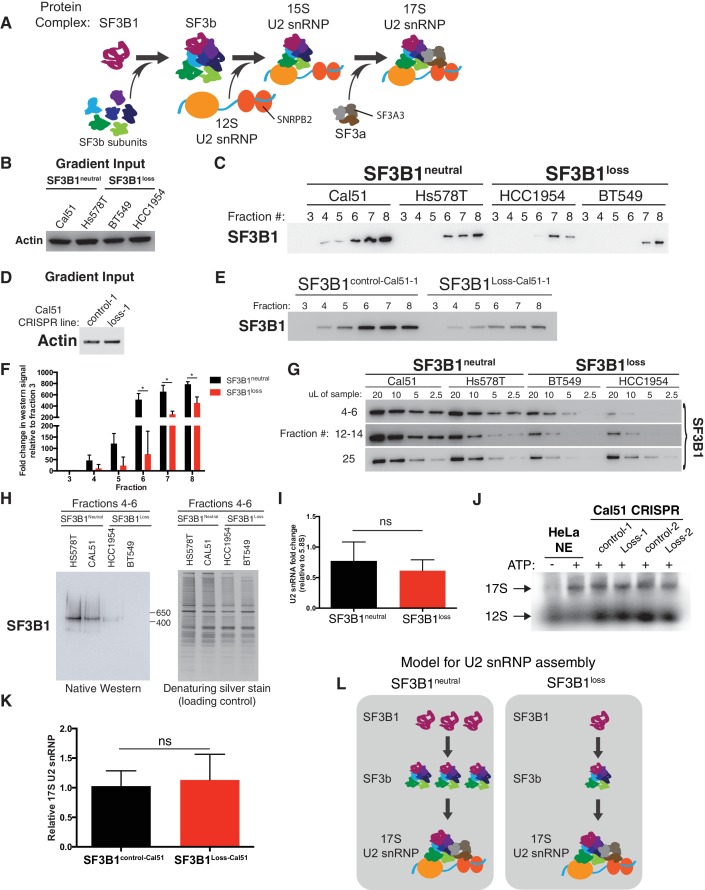
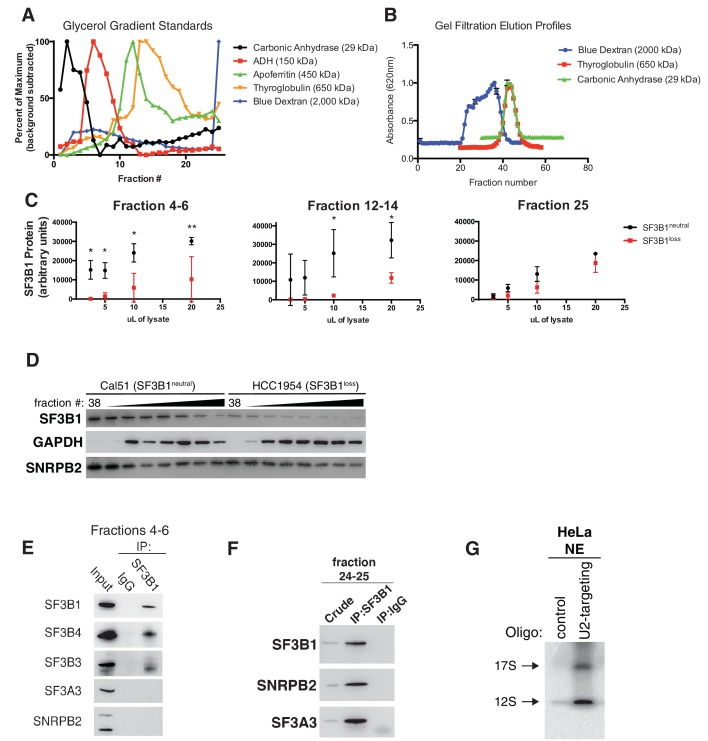
Figure 4. SF3B1 copy-loss selectively reduces the abundance of the SF3b complex.
(A) Diagram of U2 snRNP assembly. (B–C) Glycerol gradient fractionation of native whole-cell lysates probed by western blot in breast cancer cell lines and (D–E) isogenic cells generated by CRISPR. (F) Quantification of SF3B1 immunoblots from glycerol gradient fractions 3–8, relative to fraction 3 (n = 3 for each group, see Appendix Methods). (G) Serial dilution of pooled glycerol gradient fractions probed for SF3B1 by immunoblot. (H) (left) SF3B1 Native PAGE immunoblot of pooled glycerol gradient fractions. (right) denaturing silver stain of total protein from the same pooled fractions as loading control. (I) Quantitative RT-PCR for U2 snRNA expression in three SF3B1neutral and three SF3B1loss breast cancer cell lines. (J) Native agarose gel of U2 snRNP complexes visualized with radiolabeled 2’ O-methyl oligonucleotides complementary to the U2 snRNA. Nuclear extracts were generated from SF3B1control-Cal51 and SF3B1Loss-Cal51 cells. HeLa cell nuclear extracts (NE) ± ATP were used as controls. Representative image from triplicate experiments. (K) Densitometric quantification of 17S U2 snRNP bands in (J) presented as fold change relative to SF3B1control-Cal51 cells. Data are from three replicate experiments. (L) Model for changes to U2 snRNP assembly associated with SF3B1 copy-loss. For all panels, *p<0.05, and error bars represent ± SD, ns = not significant.


