. 2017 Feb 8;6:e23268. doi: 10.7554/eLife.23268

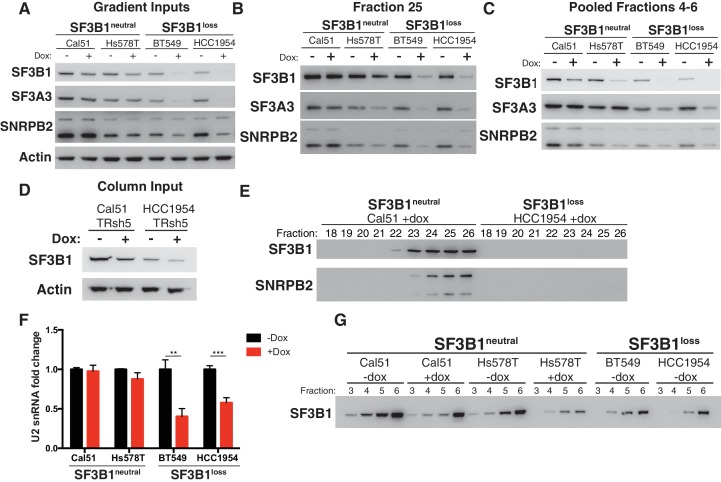
Figure 5. Reduced spliceosome precursors and U2 snRNP abundance upon SF3B1 suppression in SF3B1loss cells.

(A) Western immunoblots without and with SF3B1 suppression prior to glycerol gradient fractionation. (B) Western immunoblots from glycerol gradient fraction 25 (protein complexes >650 kDa). (C) Western immunoblots from pooled glycerol gradient fractions 4–6 (protein complexes ~150–450 kDa). (D) Immunoblot from lysates prior to gel filtration chromatography. (E) Immunoblot of gel filtration fractions 18–26 (protein complexes >650 kDa) from lysates with SF3B1 suppression. (F) Quantitative RT-PCR for U2 snRNA expression without and with SF3B1 suppression. (G) Glycerol gradient fractions from SF3B1neutral cells without and with SF3B1 suppression compared to SF3B1loss without suppression. For all panels, TR-shSF3B1#5 was used. *p<0.05 **p<0.01 ***p<0.001.

DOI: http://dx.doi.org/10.7554/eLife.23268.011

Figure 5.

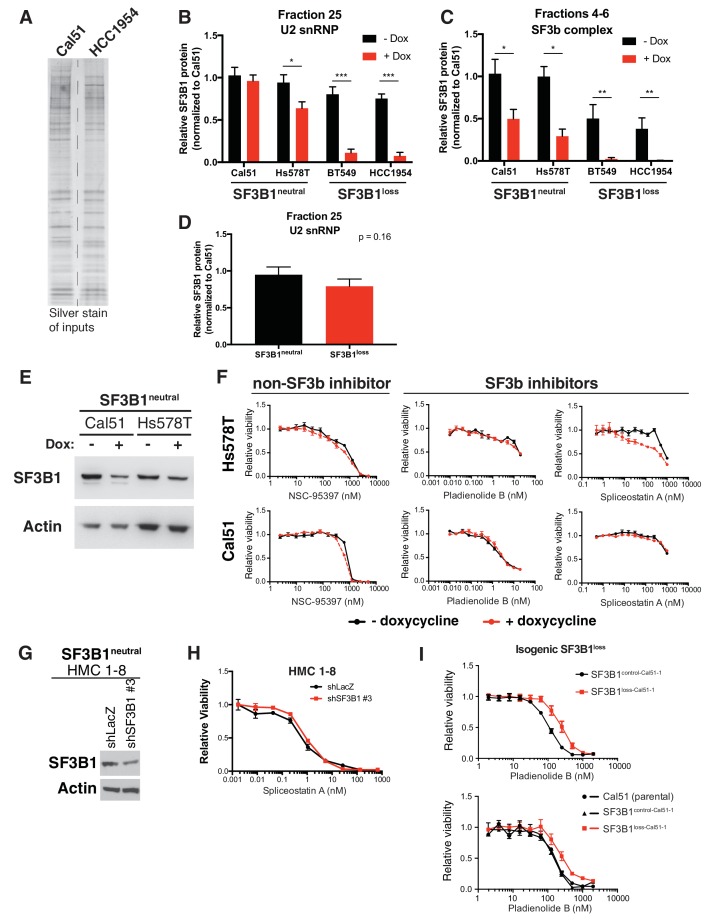
Figure 5—figure supplement 1. Reduced spliceosome precursors and U2 snRNP abundance upon SF3B1 suppression in SF3B1loss cells.

Figure 5—figure supplement 1.

(A) Silver stain of gel filtration inputs for Figure 5E. (B) Quantification of SF3B1 immunoblots from glycerol gradient fraction 25 in Figure 5B, relative to Cal51 (n = 3 for each cell line, see Appendix Methods). (C) Quantification of SF3B1 immunoblots from glycerol gradient fractions 4–6 in Figure 5C, relative to Cal51 (n = 3 for each cell line, see Appendix Methods). (D) Quantification of SF3B1 immunoblots of only the minus doxycycline treated lanes from glycerol gradient fraction 25 in Figure 5B, relative to Cal51. (n = 2 cell lines per group averaged from three technical replicates per cell line). (E) SF3B1 immunoblot from cells used in panel F (with TR-shSF3B1#5). (F) Drug sensitivity curves for indicated splicing modulators in cells without and with SF3B1 suppression (TR-shSF3B1#5). (G) SF3B1 immunoblot from HMC1–8 cells stably expressing shLacZ or shSF3B1 #3 used in panel H. (H) Spliceostatin A drug sensitivity curve for SF3B1neutral HMC1–8 cells stably expressing shLacZ or shSF3B1 #3 hairpins. (I) Pladienolide B drug sensitivity curves in SF3B1loss-Cal51 cells and SF3B1control-Cal51 or parental Cal51 cells. For all panels, *p<0.05 **p<0.01 ***p<0.001.