Figure 7. SF3B1 suppression inhibits tumor growth in vivo.
Luminescent quantification of xenograft growth from SF3B1control-Cal51-1 (black) and SF3B1Loss-Cal51-1 (red) tumors (A) without doxycycline (n = 4) and (B) with doxycycline (n = 17) using TR-shSF3B1 #3. (C) Representative animal images overlaid with heat maps from bioluminescent tumor detection. Dashed circle represents region where established tumor was detected prior to doxycycline treatment. (D) Quantification of Ki67+ cells from xenografts 42 days post tumor detection using CellProfiler ≥ 2440 nuclei were scored for each tumor, ≥ 3 tumors per group (see Materials and methods). (E) Representative Ki67 immunohistochemistry images of xenografts quantified in panel (D). (F) Growth of established tumors for Cal51 and HCC1954 xenografts without doxycycline (black) or with doxycycline (red) using TR-shSF3B1 #3. For Cal51 and HCC1954 no doxycycline groups (n = 13); plus doxycycline groups (n = 12). For all panels, ***p≤0.001.

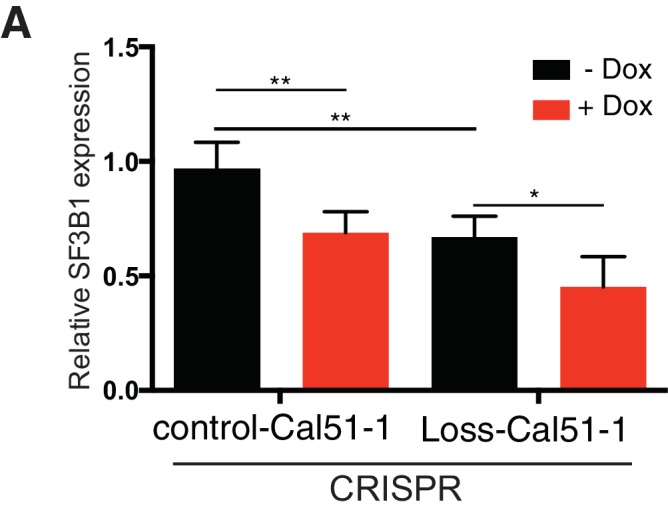
Figure 7—figure supplement 1. SF3B1 suppression inhibits tumor growth in vivo.