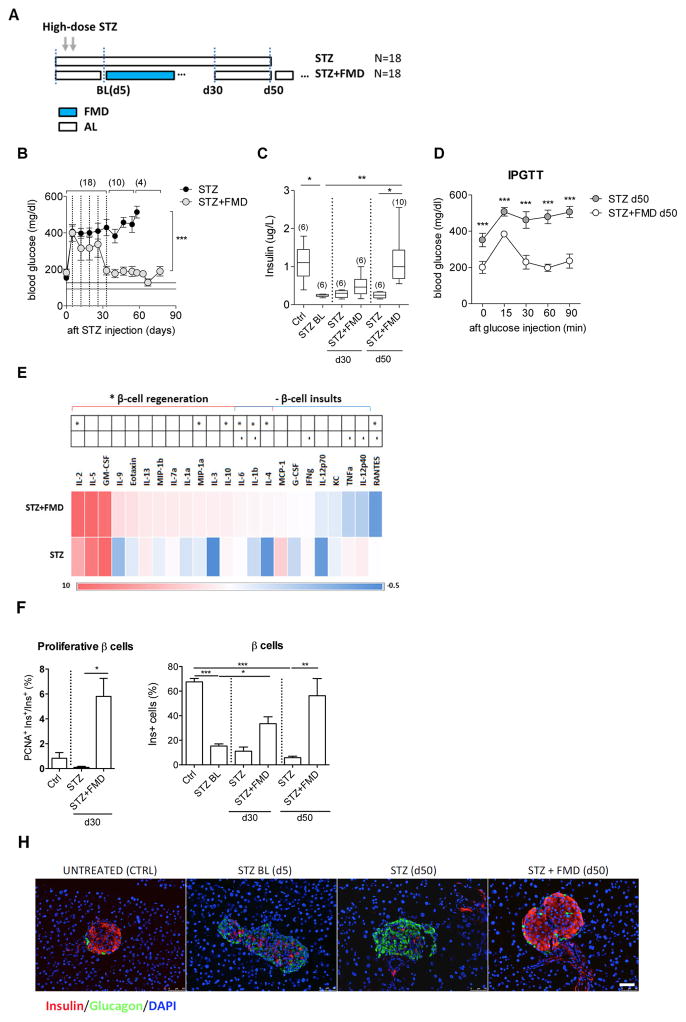
Figure 2. FMD cycles reverse STZ-induced β-cell depletion and restore glucose homeostasis.
(A) Experimental scheme of the periodic FMD’s effects on STZ-induced T1D; Baseline measurements (BL) were performed at day 5 after STZ treatment.
(B) Fasting glucose levels and (C) Plasma insulin levels during and 55 days after the FMD cycles (d5 to d35); vertical dashed lines indicate each cycle of FMD; horizontal lines (125±12mg/dl) indicate levels of blood glucose in the naïve control mice.
(D) Glucose tolerance test at d50.
(E) Cytokine profile of mice treated with STZ or STZ+FMD at d30, compared to that in naïve controls.
Pancreatic samples collected at indicated time points were analyzed for:
(F) Proliferative proportion in β cells.
(G) Proportion of insulin-producing β cells per islet and (H) Representative micrographs with immunostaining of insulin, glucagon and DAPI on pancreas sections of mice treated with STZ or STZ + FMD at the indicated time points. Scale bar represents 50um.
Mice of the C57BL/6J background, age 3–6 months, received STZ treatments (150 mg/kg) as indicated in (A). For (B–G), each point represents the mean ± s.e.m and sample size (n) is indicated in parentheses and for (F and G), *p<0.05, **p<0.01, ***p<0.005, one-way ANOVA. Ctrl, STZ-untreated control; STZ BL, baseline level of STZ treated mice at day 5. n≥6 mice per group per time point, n≥15 islets per mouse.

