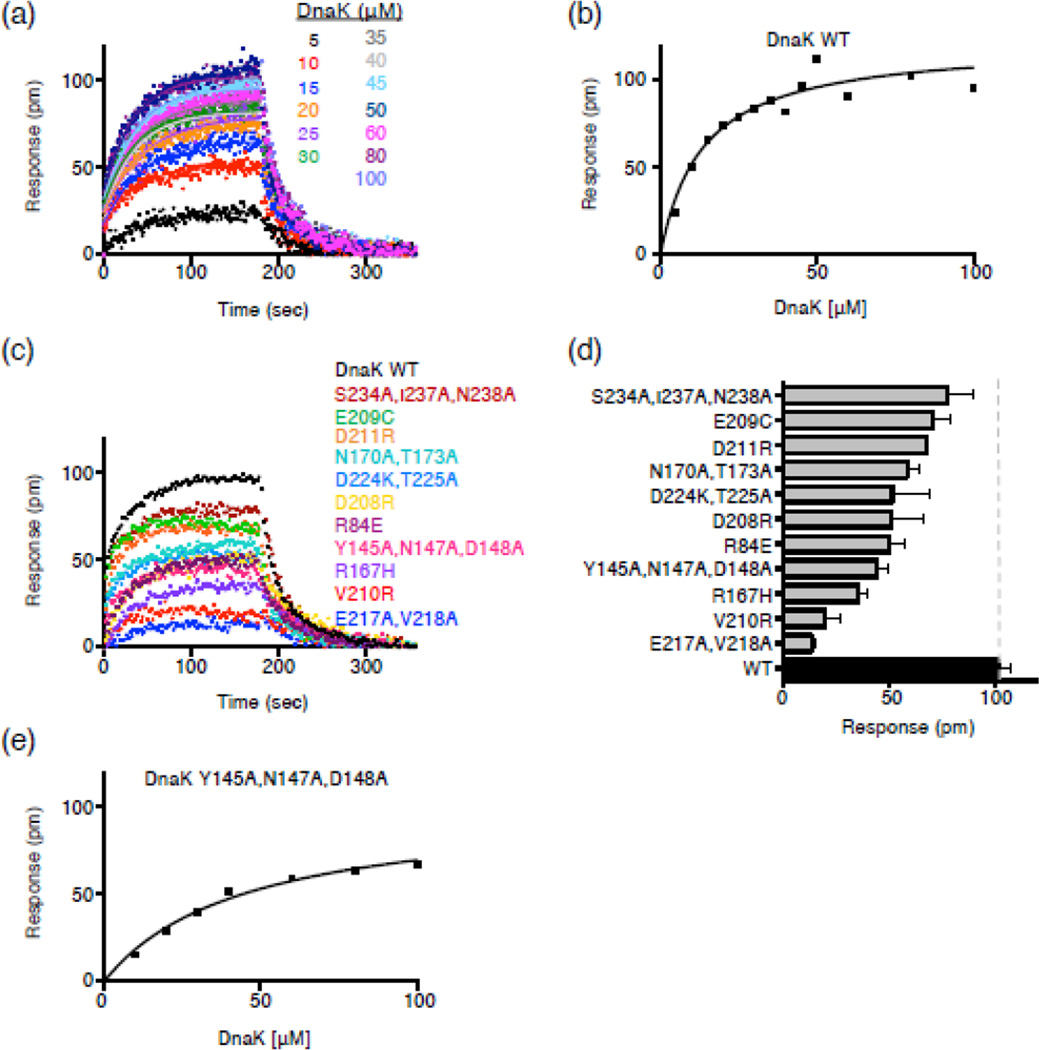
Fig. 3.
DnaK NBD substitution mutants are defective in direct interaction with Hsp90Ec in vitro. (a) Bio-Layer Interferometry (BLI) was used to monitor the kinetics of association and dissociation between biotinylated Hsp90Ec and DnaK wild-type as described in Materials and Methods. Representative curves are shown for numerous concentrations of DnaK as indicated. The single-exponential fit of the association step was used to obtain the response value (pm) for the plateau plotted in (b). (b) Steady-state analysis of the DnaK wild-type-Hsp90Ec interaction. The response value (pm) for the plateau obtained in (a) is plotted vs. each DnaK concentration and fit as described in Materials and Methods. The Kd and Bmax for the Hsp90Ec interaction with DnaK wild-type are 13.4 ± 3.3 µM and 0.12 ± 0.01 nm, respectively. (c) Curves showing association and dissociation of 50 µM DnaK wild-type (black) or mutant (colored) and biotinylated Hsp90Ec using BLI. (d) Average plateau response value for the interaction between DnaK wild-type or mutant and biotinylated Hsp90Ec. Data are plotted as mean ± SEM (n=2 or more) and are also presented in Supplemental Table S5. (e) Steady-state analysis of the DnaKY145A,N147A,D148A-Hsp90Ec interaction as described in (b). The Kd and Bmax for the Hsp90Ec interaction with DnaKY145A,N147A,D148A are 44.4 ± 7.5 µM and 0.10 ± 0.01 nm, respectively.

