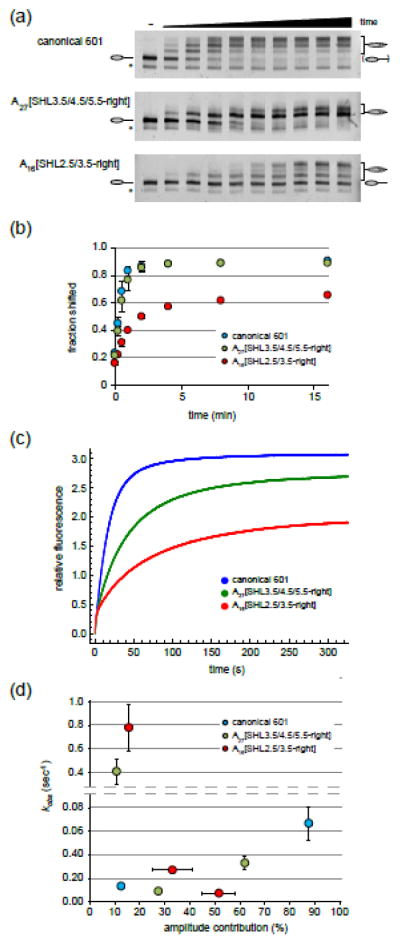
Figure 5. Internal poly(dA:dT) tracts affect the rate of nucleosome sliding by Chd1.
(a) Shown are nucleosome sliding reactions, analyzed on native acrylamide gels. End-positioned 0-N-80 nucleosomes (150 nM) were incubated with Chd1 (50 nM) for 0, 0.25, 0.5, 1, 2, 4, 8, 16, 32, and 64 min. Nucleosomes were visualized using a DNA FAM label. Asterisks denote hexasomes, which were not shifted. Gels are representative of three independent experiments.
(b) Quantification of native gel nucleosome sliding experiments, such as those shown in (a). Each point is the average of three experiments, and error bars (sometimes obscured by the symbols) give the standard deviations.
(c) Chd1 nucleosome sliding reactions monitored with Cy3B-Dabcyl static quenching. Stopped flow experiments were carried out using 0-N-80 nucleosomes (10 nM) and saturating (600 nM) Chd1 in the presence of 25 μM ATP. Each trace, which is the average of 3–6 technical replicates, is representative of four or more independent experiments.
(d) Analysis of stopped flow nucleosome sliding rates. Observed rates from double (canonical 601) and triple exponential fits (poly(dA:dT) tract variants) are given along the y-axis, with the corresponding amplitudes along the x-axis. The reported values are the averages from three or more independent experiments, with standard deviations shown with error bars that are sometimes obscured by symbols.

