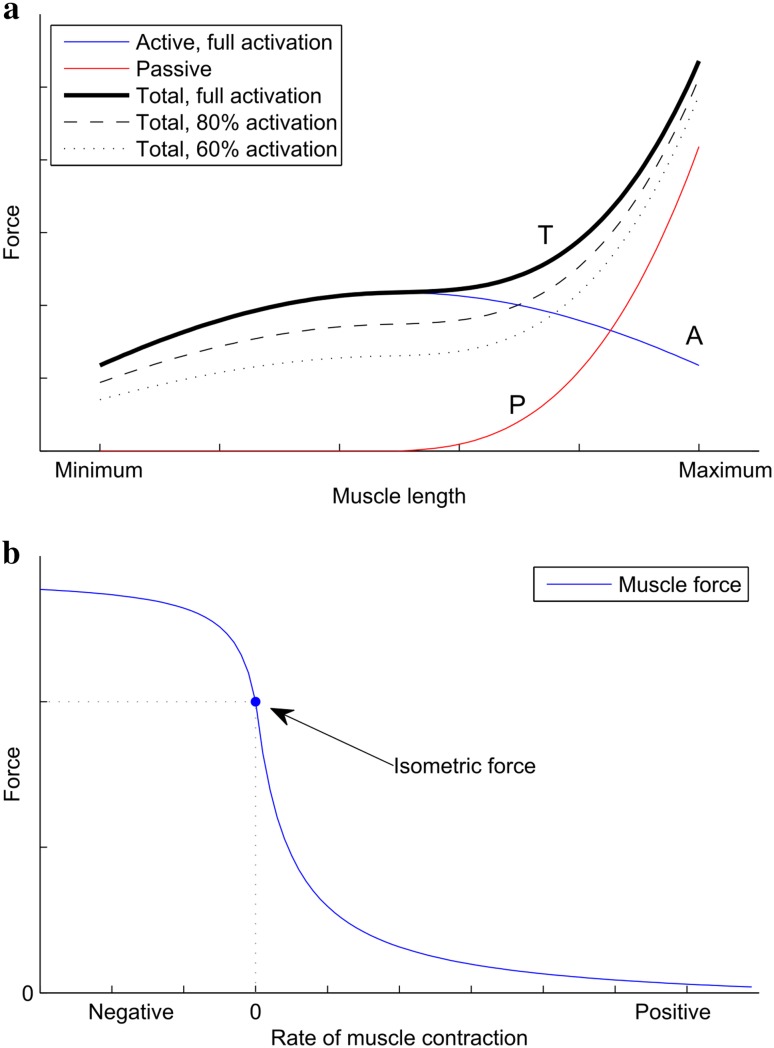
Fig. 1.
a A typical force-length diagram (not to scale) for an isolated striated muscle [1]. Two components contributing to total force production (T, black) are shown: active (A, blue) and passive (P, red). Total forces for different levels of muscle activation are shown in black in different styles (100 %—solid, 80 %—dashed, 60 %—dotted). b A typical force–velocity diagram (not to scale) for an isolated striated muscle [2]

