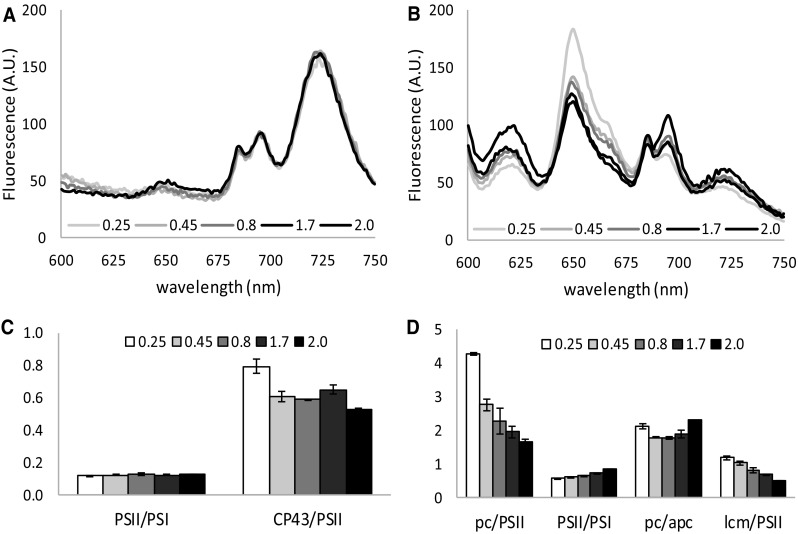
Fig. 4.

Growth phase-dependent changes in light adaptation, as demonstrated with 77K fluorescence emission spectra of Synechocystis with 435 nm (a, c) and 590 nm (b, d) excitation. Shown are fluorescence emission spectra at different optical densities taken in growth light (GL) conditions, normalized to the area under the curve and the ratios between several peaks. Peak area was determined using the peak fitting add-in for excel from http://www.chem.qmul.ac.uk/software/expfit.htm on raw data. Peak at 620 nm, measurement artifact (see M&M); 655 nm, pc; 665 nm, apc; 686 nm, lcm; 696 nm, PSII; 720 nm, PSI. Data were derived from biological duplicates and technical triplicates; shown is the average with standard deviation
