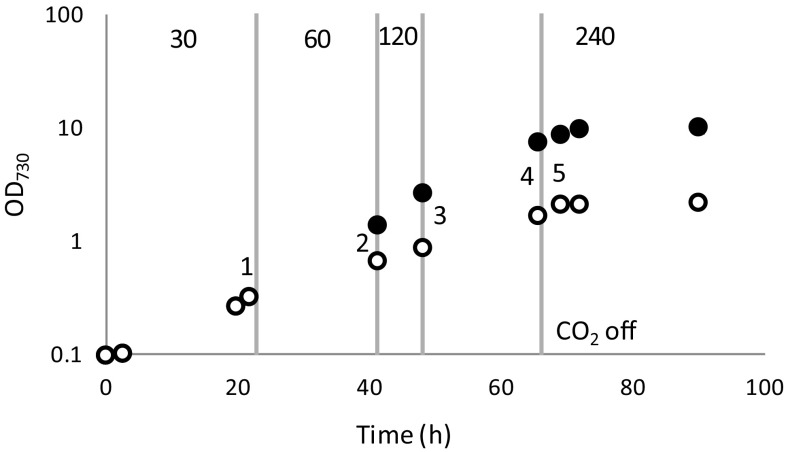
Fig. 6.
Growth curve of Synechocystis in BG-11 medium in two illumination regimes with 10 mM TES-KOH pH 8 and air + 1% CO2 bubbling. White dots cultures growing at 30 μmol photons m−2 s−1. Black dots cultures growing under increasing incident light intensity conditions as indicated by the vertical gray lines and the light intensity marked at the top in μmol photons m−2 s−1. Gray dotted line, CO2 supply stopped for all cultures, to induce carbon limitation and a transition to the stationary phase. Shown is the average of four individual batch cultures; standard deviations were too small to be visible beyond the size of the data points. The numbers in the figure refer to the sampling points at which cells were analyzed with qPCR (see Fig. 7)

