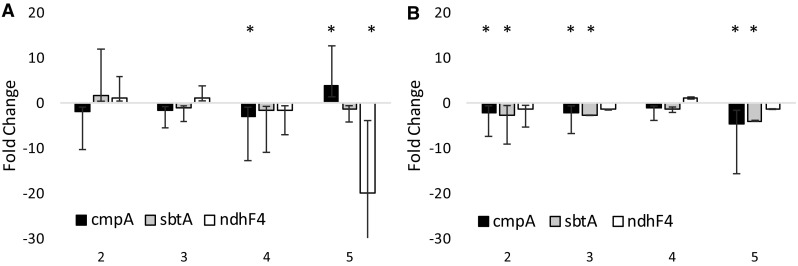
Fig. 7.

Fold change in the expression levels of three Ci transporters at different stages of growth in Synechocystis, analyzed with qPCR. a Changes in expression in cultures growing exponentially at increasing light intensities (black dots in Fig. 6) relative to the expression levels at the lowest light intensity (#1 in Fig. 6). b Changes in expression in linearly growing cultures at low light intensity (open dots in Fig. 6) relative to the expression levels when growth was still exponential (#1 in Fig. 6). Significant change is marked with an asterisk. cmpA stands for the subunit of the ATP-dependent HCO3 transporter; sbtA, Na+-dependent HCO3 transporter; ndhF4, subunit of NADPH-dependent CO2 transporter. Expression levels were normalized to the expression of the housekeeping gene rnpB. Shown are the averages of biological duplicates with the relevant error range
