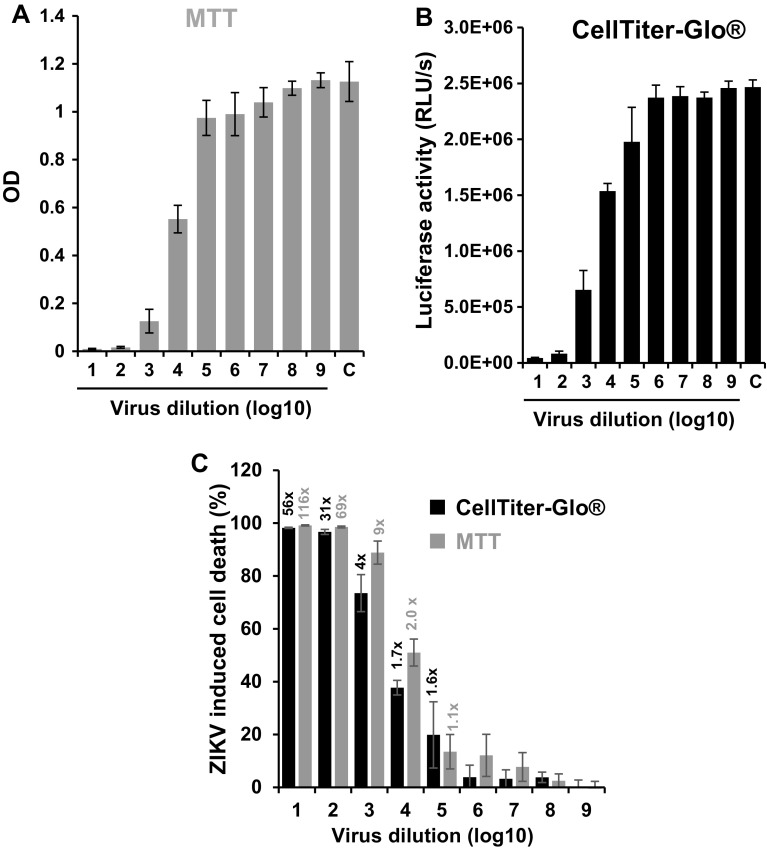
Fig. 2.
Comparison of the colorimetric MTT test with the enzyme-linked CellTiter-Glo® Luminescent Cell Viability Assay to quantify ZIKV infectivity. Vero E6 cells were infected with serial 10-fold dilutions of ZIKV MR766 and assayed 4 day post-infection using either a MTT assay or b the CellTiter-Glo® Luminescent Cell Viability Assay. Shown are mean OD values (a) or luciferase activities (b) derived from triple biological replicates ± standard deviation. c Direct comparison of both cell viability assays. The percentage of ZIKV-induced dead cells was calculated as described above. The numbers above the columns give the signal-to-noise ratios, i.e., the quotient of infected versus uninfected cells. C uninfected control

