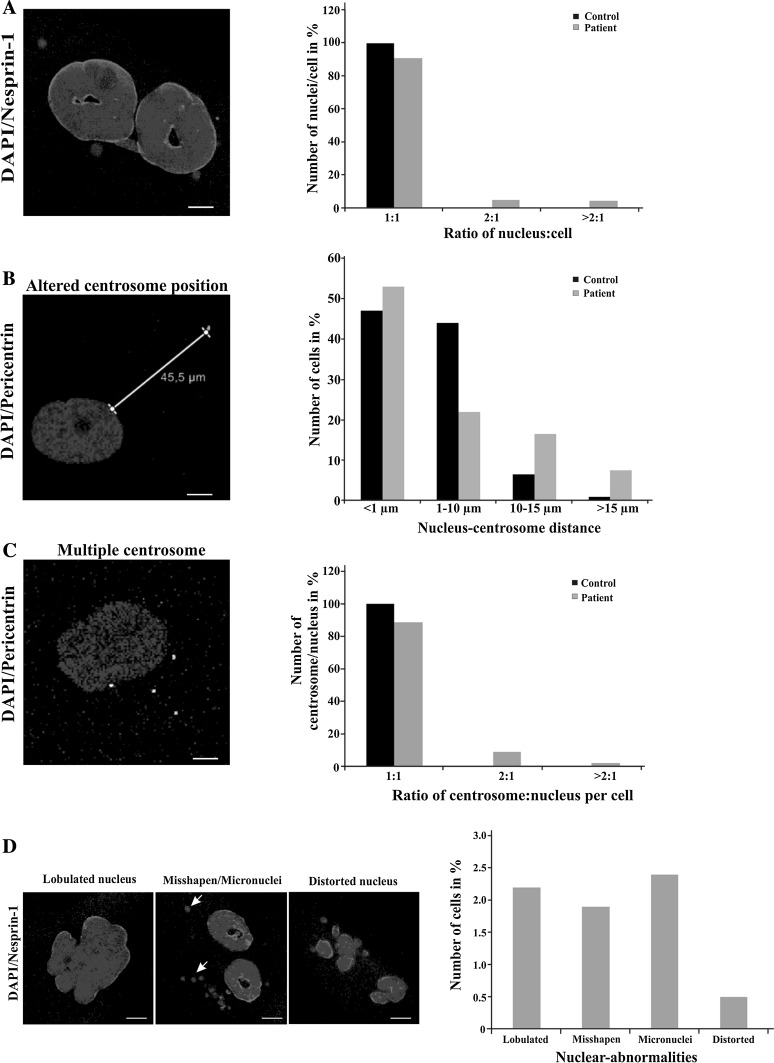
Fig. 3.
Nuclear aberrations and centrosome defects in patient cells. a Number of nuclei per cell. 450 control and 550 patient cells were evaluated. b Percentage of cells with the indicated nucleus–centrosome distance. The mean distance was 2.46 µm for control and 4.62 µm for patient cells. The difference was, however, not statistically significant. More than 100 cells were evaluated per strain. c Number of centrosomes per nucleus. ~450 cells were evaluated each. d Nuclear abnormalities as specified. More than 700 cells were evaluated. Percentage of cells with the abnormalities is shown in the bar graphs (a–d). Polyclonal antibodies (SpecII) against Nesprin-1 and pericentrin-specific antibodies were used to detect the nuclear envelope and the centrosome, respectively. DAPI was used to stain the nuclei. Arrows point to micronuclei. For the experiments passage 4 of the fibroblasts was used. Scale bar 5 µm

