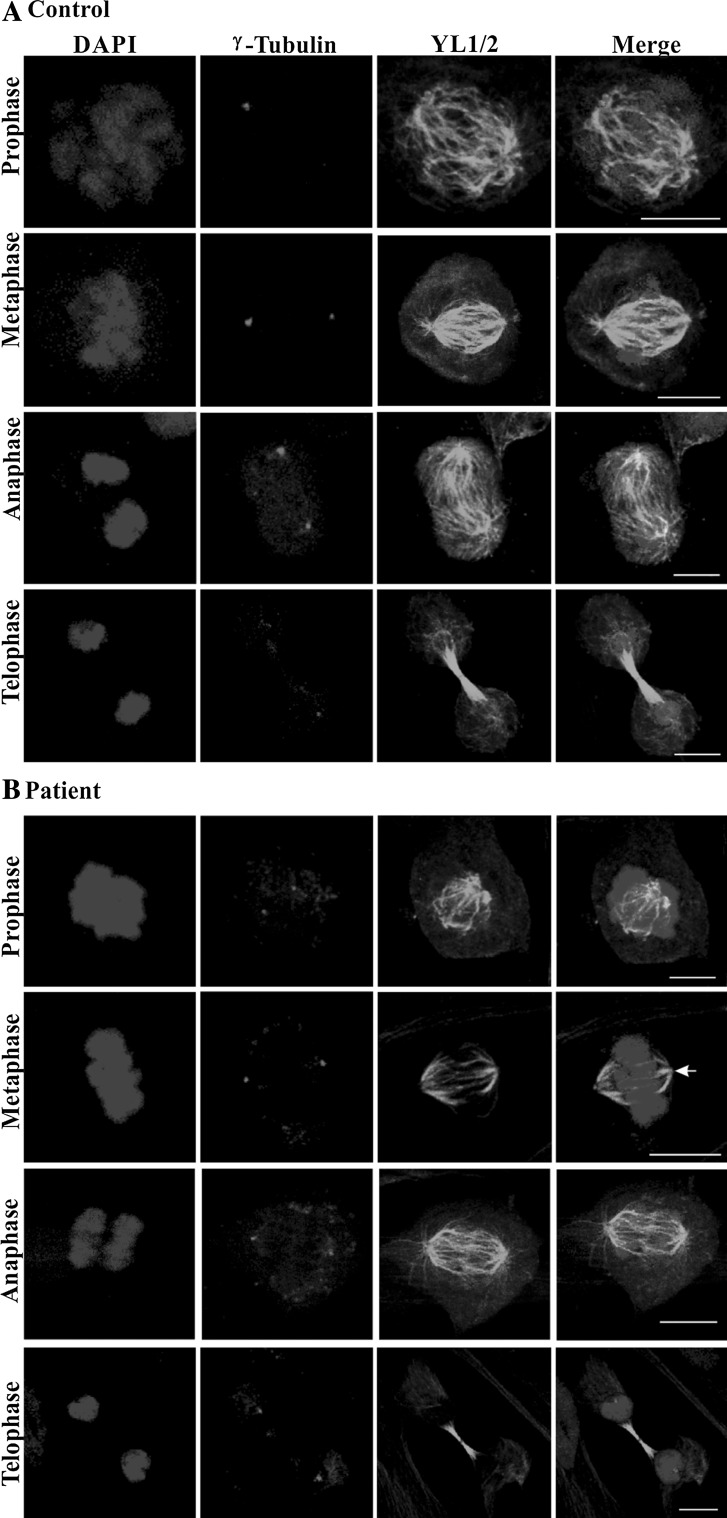
Fig. 4.
Mitotic stages in control (a) and patient cells (b). Confocal images of control and patient cells of the indicated mitotic stages are shown. Nuclei were stained with DAPI, centrosomes were detected with mouse mAb against γ-tubulin and microtubules were stained with rat mAb YL1/2. The arrow in B, metaphase, points to a spindle pole without prominent astral microtubules. Scale bar 10 µm

