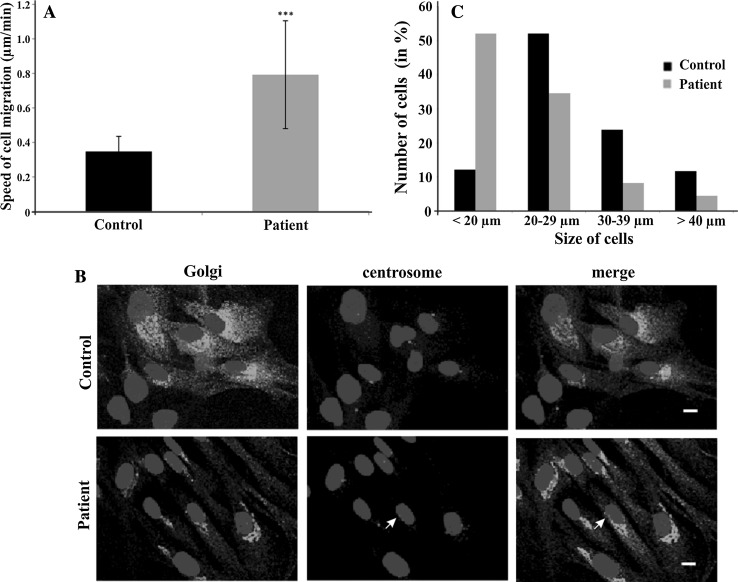
Fig. 5.
Cell migration, cell polarity and cell size analysis. a Analysis of speed during migration in µm/min (***P < 0.001). 32 cells each were analyzed. b Cell polarity analysis. Cells migrating into a scratch wound were fixed after 7 h of migration and stained for the Golgi (anti 58 K, mAb), centrosome (anti-pericentrin, pAb) and the nuclei (DAPI). The cells were migrating towards the lower right (location of the wound). The arrow points to a centrosome which is not colocalizing with the Golgi apparatus. Scale bar 10 µm. c Cell size of control and patient cells in micrometers. ~220 and 390 cells were analyzed, respectively

