Fig. 6.
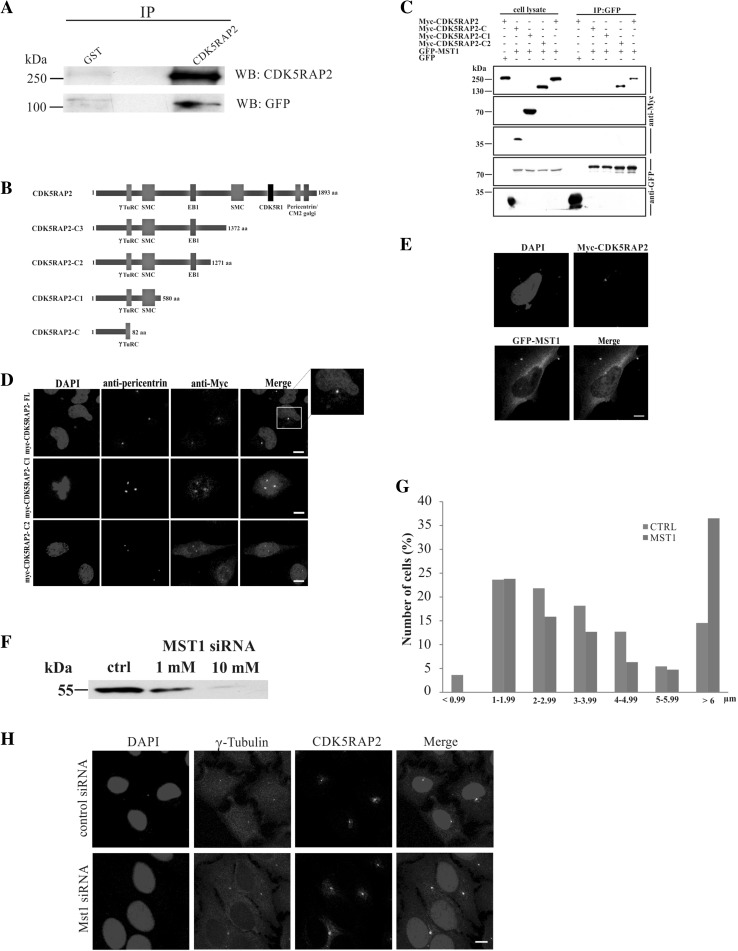
CDK5RAP2 and the link to Hippo pathway components. a Co-immunoprecipitation of CDK5RAP2 and GFP-MST1. CDK5RAP2 was immunoprecipitated from HeLa cell lysates expressing GFP-MST1. GFP-MST1 and CDK5RAP2 were detected with GFP-specific mAb K3-184-2 and polyclonal CDK5RAP2 antibodies, respectively. GST-specific polyclonal antibodies were used for control. b Schematic of Myc-tagged CDK5RAP2 proteins. The amino acid residues and the domains are indicated. c CDK5RAP2 interaction with MST1. Myc-tagged CDK5RAP2 proteins were coexpressed in HEK293T cells with GFP-tagged MST1 and Myc-tagged polypeptides precipitated with Myc antibodies. GFP-MST1 was detected in the precipitates with mAb K3-184-2. GFP was used for control. d Immunofluorescence analysis of HeLa cells expressing Myc-tagged CDK5RAP2 proteins. Myc was recognized by mAb 9E10, pericentrin was detected with polyclonal antibodies, nuclei were stained with DAPI. The boxed area is enlarged at the right. Scale bar 10 µm. e Immunofluorescence analysis of HeLa cells expressing Myc-tagged CDK5RAP2 and GFP-MST1. Myc antibodies mAb 9E10 detected Myc-CDK5RAP2, GFP-specific mAb K3-184-2 detected GFP-MST1, the centrosome was detected with pericentrin-specific antibodies, DNA was stained with DAPI. Scale bar 10 µm. f Knockdown of MST1 with siRNA in HeLa cells leads to reduced MST1 protein amounts and an increased centrosome nucleus distance. Detection of the centrosome was with γ-tubulin-specific antibodies. G Bar graph analysis of the centrosome nucleus distance. The distance from the nucleus was determined using the Leica LAS AF lite program. The number of cells in percent is given. For control 58 cells and for the knock down 66 cells were evaluated. h Immunofluorescence analysis of control and MST1 knockdown cells staining for γ-tubulin and CDK5RAP2. Cells treated with 1 nM siRNA are shown. Scale bar 10 µm

