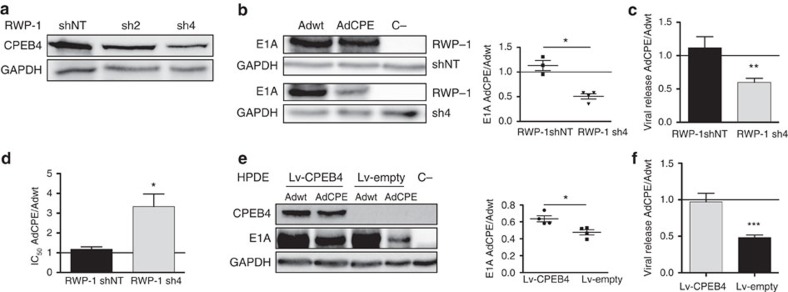
Figure 3. CPEB4 regulates AdCPE E1A expression and viral fitness.
(a) Representative western blot of CPEB4 protein downregulation in RWP-1 tumour cells. shNT, non-targeted; sh2 and sh4, two different sh sequences against CPEB-4. (b) Representative western blot of E1A expression in RWP-1 shNT and RWP-1 sh4, infected with Adwt and AdCPE 72 h postinfection. Quantification of the E1A signal was normalized to glyceraldehyde 3-phosphate dehydrogenase (GAPDH) and expressed as relative values of AdCPE/Adwt (n=4). *P<0.05. (c) Quantification of relative viral production (AdCPE/Adwt) in the supernatant of sh4 and shNT RWP-1-infected cells 72 h postinfection. Data are shown as mean±s.e.m. from five independent biological replicates. **P<0.01 (two-tailed Mann–Whitney test). (d) Cytotoxicity assay in sh4 and shNT RWP-1 cells infected with Adwt or AdCPE for 72 h. IC50 was calculated for each cell line from dose–response curves. Data are shown as mean±s.e.m. from six independent biological replicates. *P<0.05 (two-tailed Mann–Whitney test). (e) The left panel shows a representative western blot of the E1A protein in non-tumour HPDE cells transduced with a lentivirus-expressing CPEB4 (Lv-CPEB4) or a control lentivirus (Lv-empty) and infected with Adwt or AdCPE. E1A content was evaluated 72 h postinfection. The right panel shows quantification of the E1A signal that was normalized to GAPDH and expressed as relative values of AdCPE/Adwt (n=5). *P<0.05. (f) Quantification of relative viral genome release in HPDE supernatants from cells transduced with Lv-CPEB4 or Lv-empty and infected with Ad-WT or AdCPE for 72 h. Data are shown as mean±s.e.m. of five independent biological replicates. ***P<0.001 (two-tailed Mann–Whitney test).

