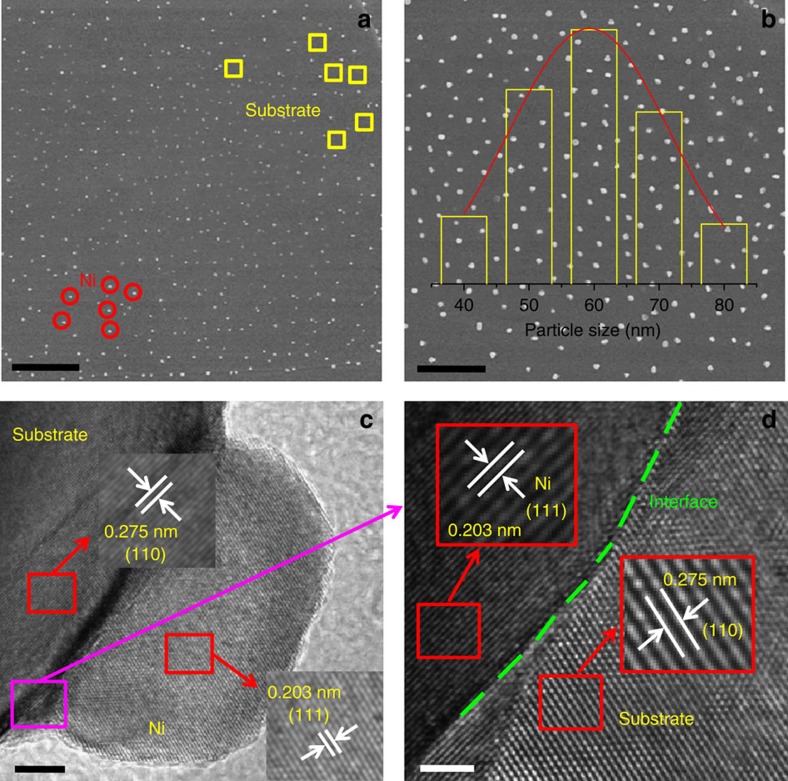
Figure 2. Scanning electron microscopy and high-resolution transmission electron microscopy for LSTMNA− sample.
(a) Scanning electron microscopic results for the reduced LSTMNA−, Scale bars, 5 μm; (b) Ni nanoparticles size distribution of the reduced LSTMNA− inset, Scale bars, 3 μm; (c) High-resolution transmission electron microscopic results for the reduced LSTMNA−, Scale bars, 5 nm; (d) the legible hetero-junction of Ni and substrate along the corresponding to pink square shown in (c), Scale bars, 2 nm.

