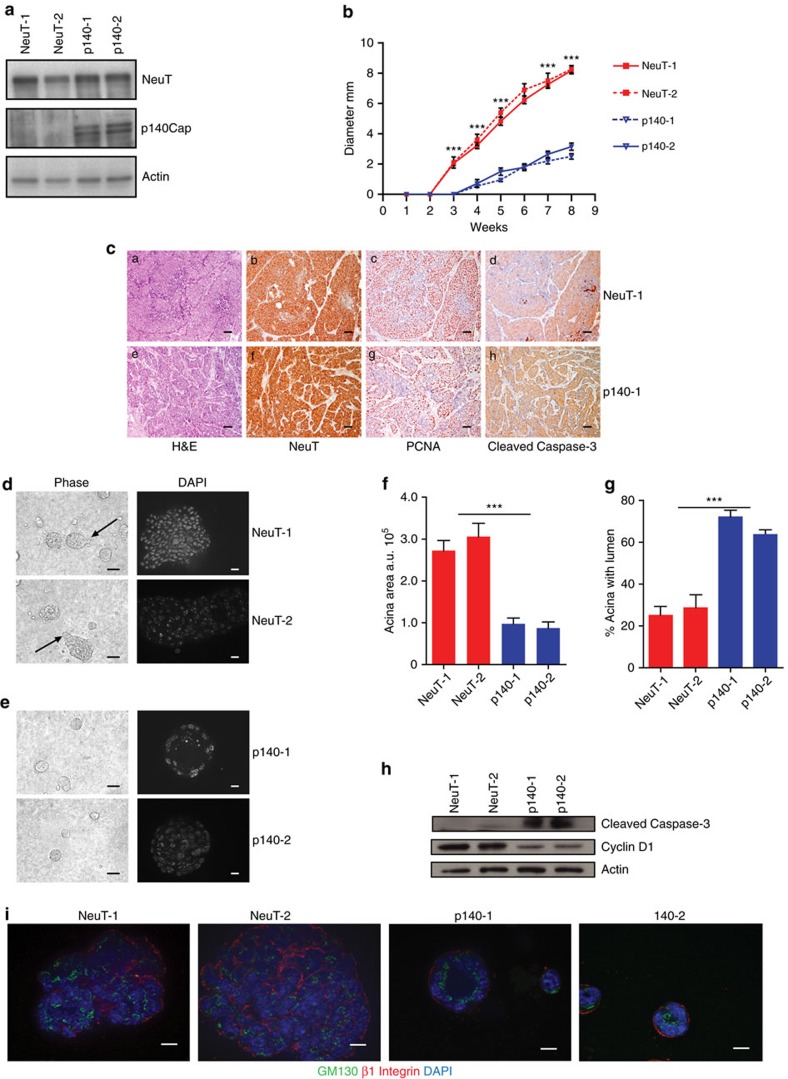
Figure 4. Primary p140 cancer cells restore mammary epithelial acina morphogenesis in 3D Matrigel-Collagen cultures.
(a) Protein extracts from two independent primary cancer cells for each genotype (NeuT-1, NeuT-2, p140-1 and p140-2) were run on 6% SDS–PAGE and stained with antibodies to NeuT, p140Cap and actin for loading control. (b) 106 cells as in a were injected in the left and right fat pads of nude mice. Tumour diameters were measured every week for 8 weeks. Two independent experiments were performed using five mice per group. Differences in tumour diameter were evaluated using two-way analysis of variance (ANOVA) followed by Bonferroni multiple comparison post hoc tests (***P<0.001). (c) Paraffin-embedded sections were prepared at the end of the experiments from tumours derived from mice as in b. Sections were analysed for Hematoxylin–Eosin (a,e), and for immunohistochemistry with antibodies to NeuT (b,f), PCNA (c,g) and activated Caspase3 (d,h). Representative images are shown. Scale bar, 50 μm. (d,e) Primary cancer cells for each genotype (NeuT-1, NeuT-2, p140-1, and p140-2) were plated in Matrigel/Collagen I 1:1 and left to grow for 15 days. Day 15 acina are shown as phase images in the left panels, or as Dapi nuclei staining (bright grey) in right panels. Arrows indicate the presence of invasive protrusions. Representative images from three independent experiments are shown. Scale bar, 50 μm. (f) The histogram represents the area of the acina quantified by the computer-generated software Zeiss Axiovision 4.5 and shown in arbitrary units (a.u.). (g) The histogram represents the percentage of acina structures with an internal lumen. The lumen has been manually quantified. In f and g, statistical significative differences were evaluated using unpaired t tests. Error bar: s.e.m. (***P<0.001). (h) Primary cancer cells as in d were plated in Matrigel/Collagen I 1:1 and left to grow for 12 days. Protein extracts were run on 4–12% SDS–PAGE and stained with antibodies to Cleaved Caspase 3, Cyclin D1 and Actin for loading control. (i) Primary cancer cells as in d were analysed as day 15 acinar structures by immunostaining for a cis-Golgi matrix protein, GM130 (green), and a basal marker protein, beta1 integrin (red). Nuclei were co stained with DAPI (blue). Representative images are shown. Scale bar, 50 μm.

