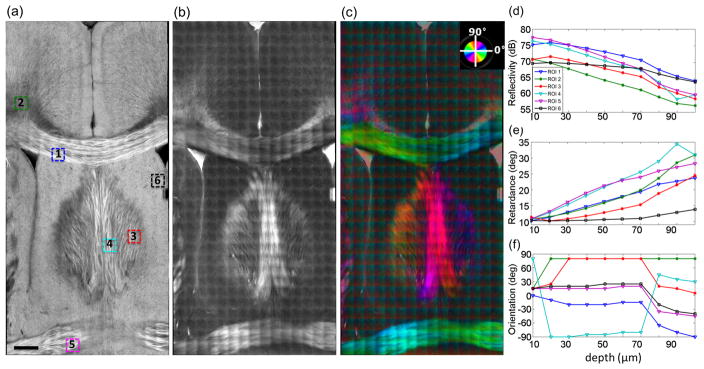
Fig. 3.
Stitched en-face images of reflectivity (a), retardance (b) and optic axis orientation (c). In (c), the orientation value is indicated by the color wheel on the top right corner. The brightness is controlled by the retardance value. The numbers in (a) indicate the ROIs where the depth profiles of reflectivity (d), retardance (e) and optic axis orientation (f) were conducted at 10 imaging depths. ROIs: 1 – corpus callosum; 2 – cingulum; 3 – fimbria of hippocampus; 4 – fornix; 5 – anterior commissure; 6 – lateral septal nucleus. Scale bar: 400 μm.

