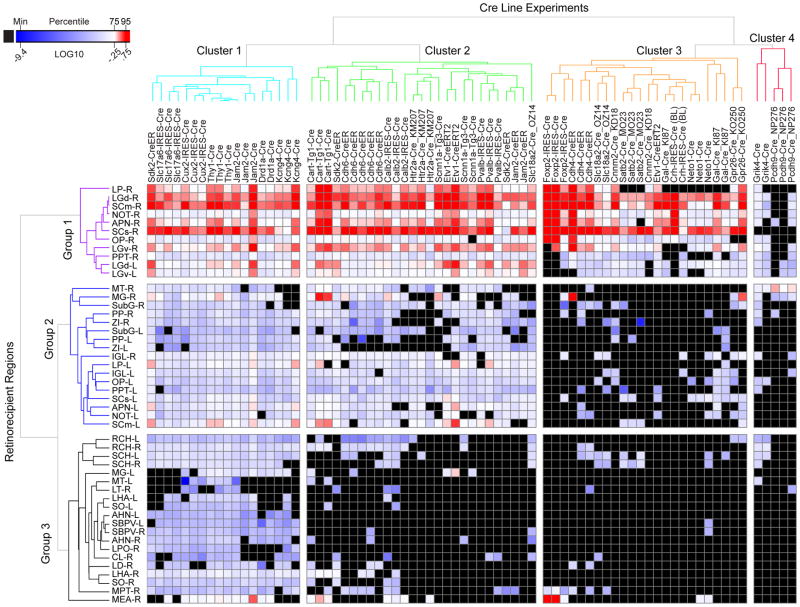
Figure 4. Retina-to-brain connectivity map.
Each column shows one injection experiment. Rows show retinorecipient regions included for quantitative analysis. The projection strength is quantified as the sum of all algorithmically-detected (segmented) fluorescent pixels within a given structure of the Allen Mouse CCF. Data were normalized by dividing the segmented projection volume in each structure with the segmented injection volume in the optic chiasm. Negative regions (no fluorescent signal or only passing fibers) verified by manual analysis are shown in black. The color map indicates Log10-transformed normalized projection volumes. Unsupervised hierarchical clustering of the experiments and target regions (using Euclidean distance and average linkage method) identified four major clusters of experiments and three major groups of retinal target regions among this set of Cre lines. Abbreviations for each target region are in Table 3. “-R” is right side and contralateral to injected eye. “-L” is left side and ipsilateral to injected eye.

