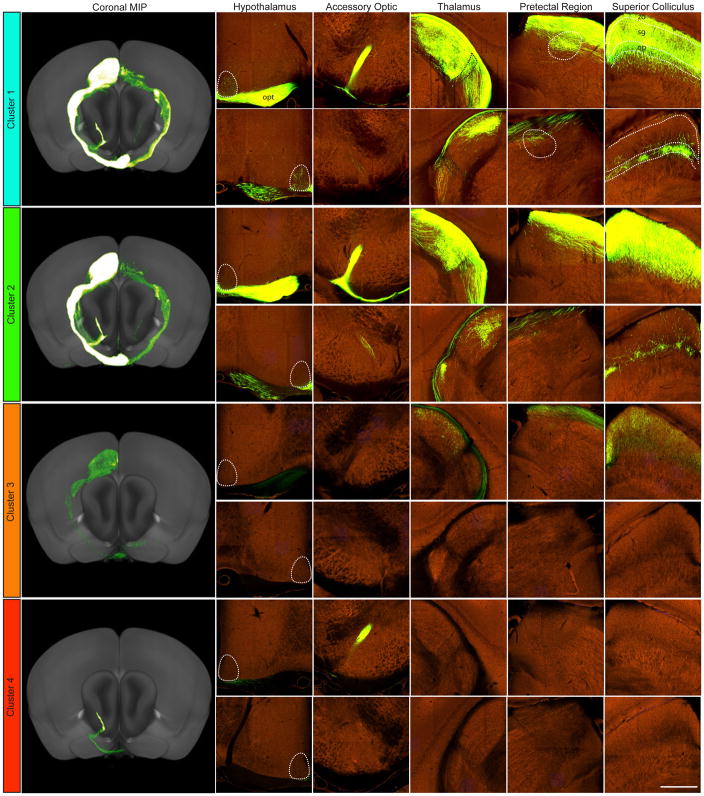
Figure 5. Projections from Cre-expressing RGCs to five major retinorecipient brain areas.
Section images are shown at the level of the hypothalamus, accessory optic nucleus, thalamus, pretectal region and superior colliculus from four Cre driver lines (a–d), one from each of the four projection clusters defined in Figure 4. A coronal view of the maximum intensity projection (MIP) of brain-wide fluorescent signal for each experiment is shown in the first column; contralateral to injected eye is on the top and ipsilateral on the bottom. All experiments in all clusters showed greater contralateral vs ipsilateral projections, but differ in the specific targets contacted by labeled axons

