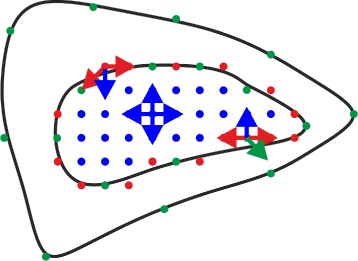
Fig. 2.

Force diagram of texture mapping approach during the adaption process. The outer contour represents new cell shape. The inner contour represents contour of the used texture. Green points are fixation points v fix between new cell shape and texture. Red points are border points v bor on texture which are not fixation points. Blue points are points in the inner of the texture. Green arrows indicate forces between corresponding points. Red arrows indicate forces between border points. Blue arrows indicate forces between bulk points v bulk
