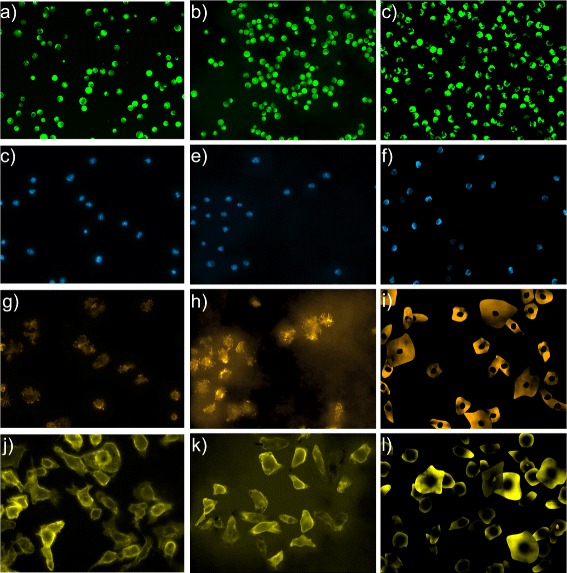
Fig. 5.

Comparison between real and simulated images: a), b), c) protoplast; d), e), f) DAPI stained nuclei; f), g), h) F-Actin channel of B cells; i), j), k) macrophages; a), d), f, and i) are real images, b), e), g), and j) are simulated with our approach while c), f), h), and k) have been simulated with SimuCell
