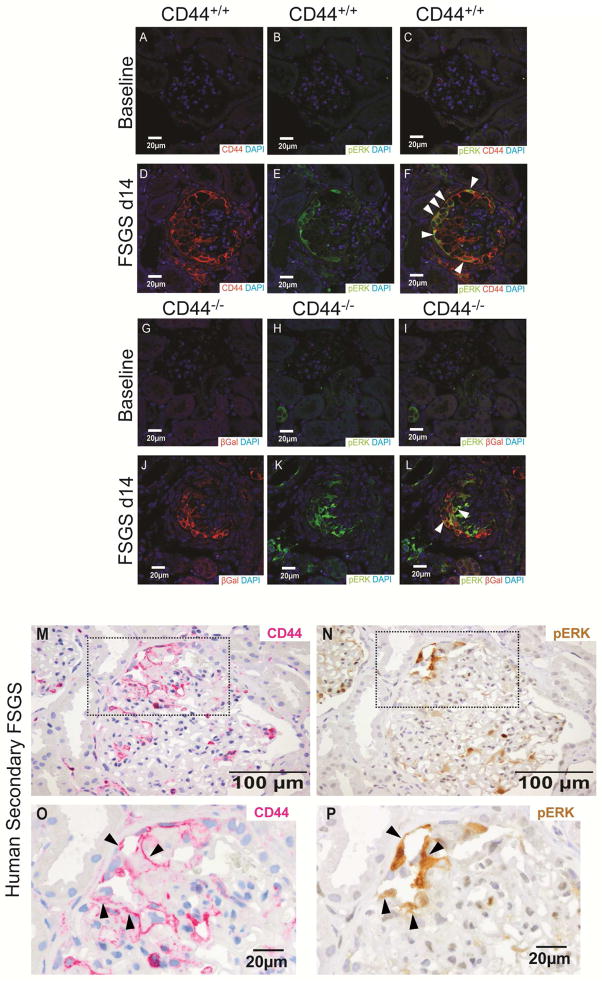
Figure 6. pERK co-localizes with CD44 in mouse and man with FSGS.
(A–C) Co-staining for CD44, pERK, and DAPI in CD44+/+ mice at baseline. (A) An image of staining for CD44 (red) and DAPI (blue) in CD44+/+ mice at baseline shows DAPI staining only. (B) An image of staining for pERK (green) and DAPI (blue) in CD44+/+ mice at baseline shows DAPI staining only. (C) A merged image of staining for CD44 (red), pERK (green) and DAPI (blue) in CD44+/+ mice at baseline shows DAPI staining only.
(D–F) Co-staining for CD44, pERK, and DAPI in CD44+/+ mice at d14 FSGS. (D) An image of staining for CD44 (red) and DAPI (blue) in CD44+/+ mice at d14 of FSGS shows CD44 staining along Bowman’s capsule and within the glomerular tuft. (E) An image of staining for pERK (green) and DAPI (blue) in CD44+/+ mice at d14 of FSGS also shows pERK staining along Bowman’s capsule and within the glomerular tuft. (F) A merged image of staining for CD44 (red), pERK (green) and DAPI (blue) in CD44+/+ mice at d14 of FSGS shows co-staining of CD44 and pERK in many cells (yellow/orange, arrowheads indicate examples).
(G–I) Co-staining for βGal, pERK, and DAPI in CD44−/− mice at baseline. (G) An image of staining for, βGal (red) and DAPI (blue) in CD44−/− mice at baseline shows DAPI staining only. (H) An image of staining for pERK (green) and DAPI (blue) in CD44−/− mice at baseline shows DAPI staining only in glomeruli. (I) A merged image of staining for βGal (red), pERK (green) and DAPI (blue) in CD44−/− mice at baseline shows DAPI staining only in glomeruli.
(J–L) Co-staining for βGal, pERK, and DAPI in CD44−/− mice at d14 FSGS. (J) An image of staining for βGal (red) and DAPI (blue) in CD44−/− mice at d14 of FSGS shows CD44 staining along Bowman’s capsule and within the glomerular tuft. (K) An image of staining for pERK (green) and DAPI (blue) in CD44−/− mice at d14 of FSGS also shows pERK staining along Bowman’s capsule and within the glomerular tuft. (L) A merged image of staining for βGal (red), pERK (green) and DAPI (blue) in CD44−/− mice at d14 of FSGS shows co-staining of βGal and pERK in cells (yellow/orange, arrowheads indicate examples). Because pERK increases in PECs in FSGS mice with and without CD44 deletion, these results are consistent with pERK being upstream of CD44.
(M–P) CD44 and pERK staining in serial sections of a human biopsy from a patient with FSGS. (M) CD44 staining (magenta) is detected in a segment of a glomerulus (top left quadrant, dashed box) along Bowman’s capsule and within the glomerular tuft in an area with synechial attachment. (O) The inset in M is shown at higher power magnification (examples of staining indicated by arrow heads) (N) pERK staining (brown) is detected in the same quadrant of the same glomerulus in a serial section, where staining co-localizes to the same cells staining for CD44. (P) The inset in N is shown at higher power magnification (examples of staining indicated by arrow heads) in the same cells that stain for CD44.

