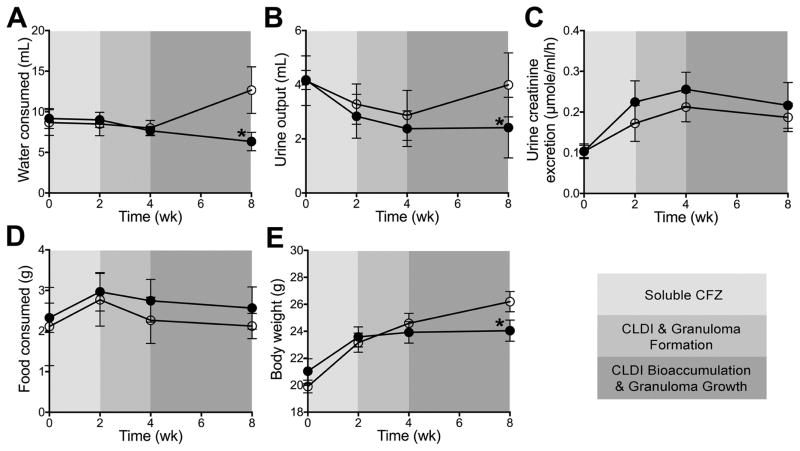
Figure 7.
Data acquired from 18h metabolic cage studies conducted at baseline
(pre-treatment) and then at each phase of clofazimine (CFZ;  ) distribution included (A) the
amount of water (mL) consumed (*p<0.0001) and (B) urine
(mL) output (*p=0.009) when compared to sham-treated (
 ) mice. Using the amount
(μmole) of urine creatinine (KEGG ID: C00791) measured by 1H-
NMR and the corresponding urine volume output (mL), urine creatinine excretion
was calculated (C) and was not different between CFZ and
sham-treated mice. Food consumed at each time point (D) did not
differ between the two groups but the total amount (g) of food consumed was
higher in CFZ-treated mice (see text) and CFZ-treated mice did not gain as much
body weight (E) as sham-treated mice (*p=0.0002)
over the 8-week study. Data are the mean (+SD) of 6 samples per group
except for body weight which are 23–24 mice per group.

