Fig. 3.

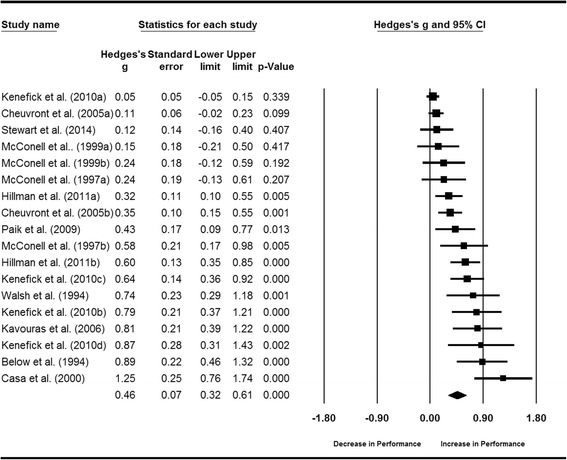
Forest plot displaying the effect of fluid intake on continuous exercise performance. Size of the squares is proportional to the weight of the study

Forest plot displaying the effect of fluid intake on continuous exercise performance. Size of the squares is proportional to the weight of the study