Fig. 6.
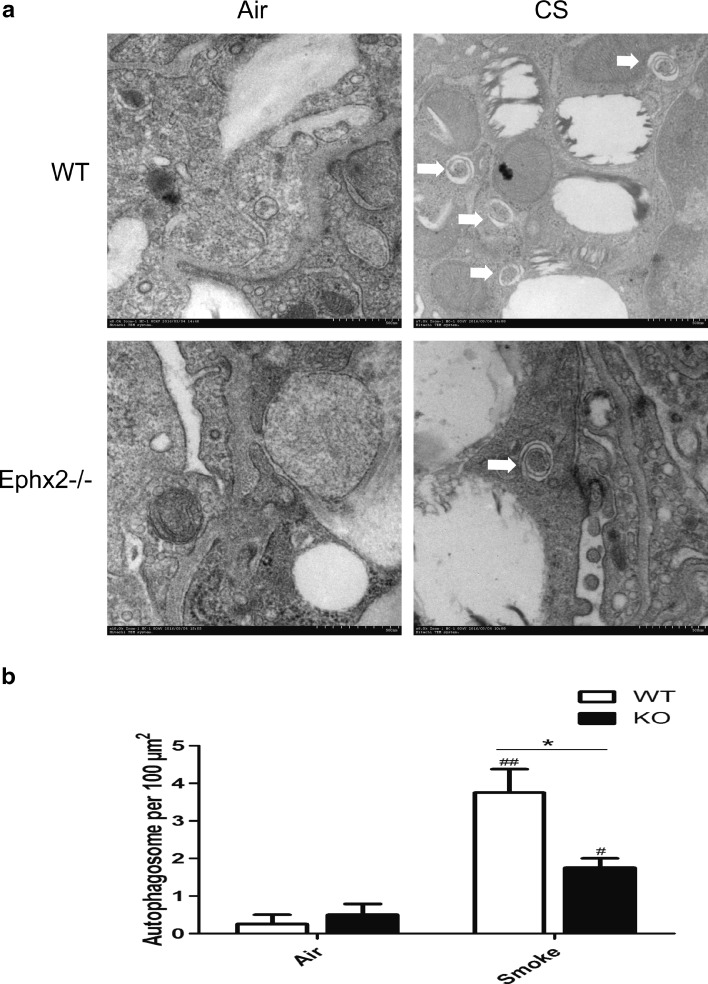
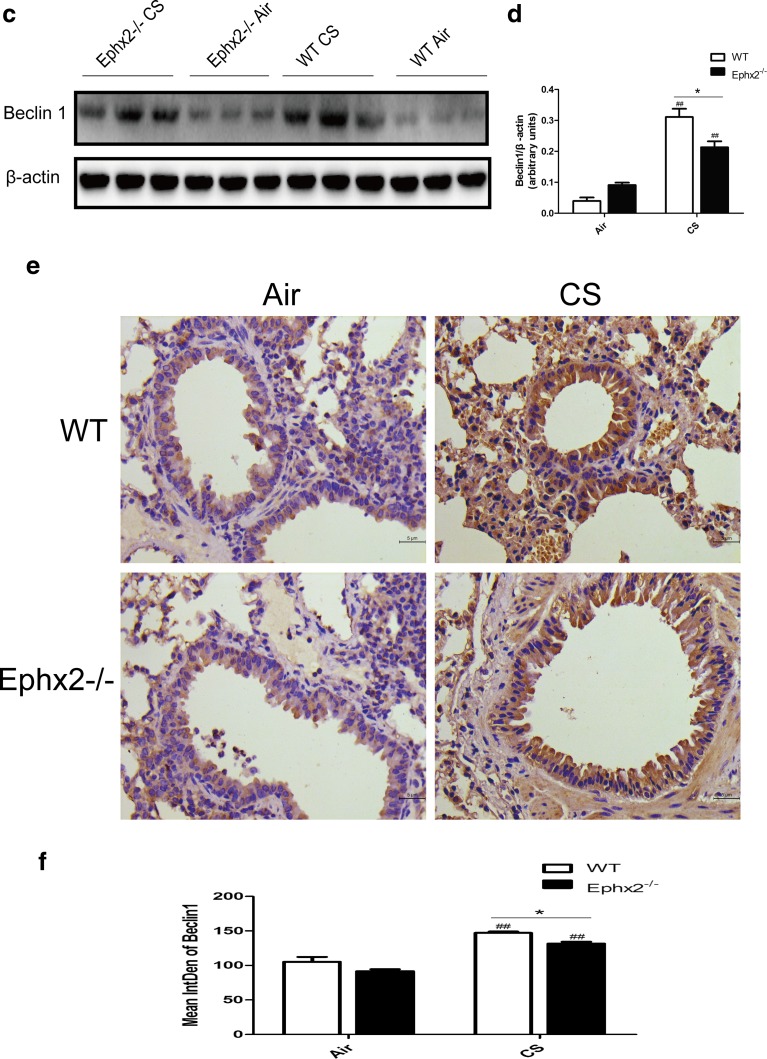
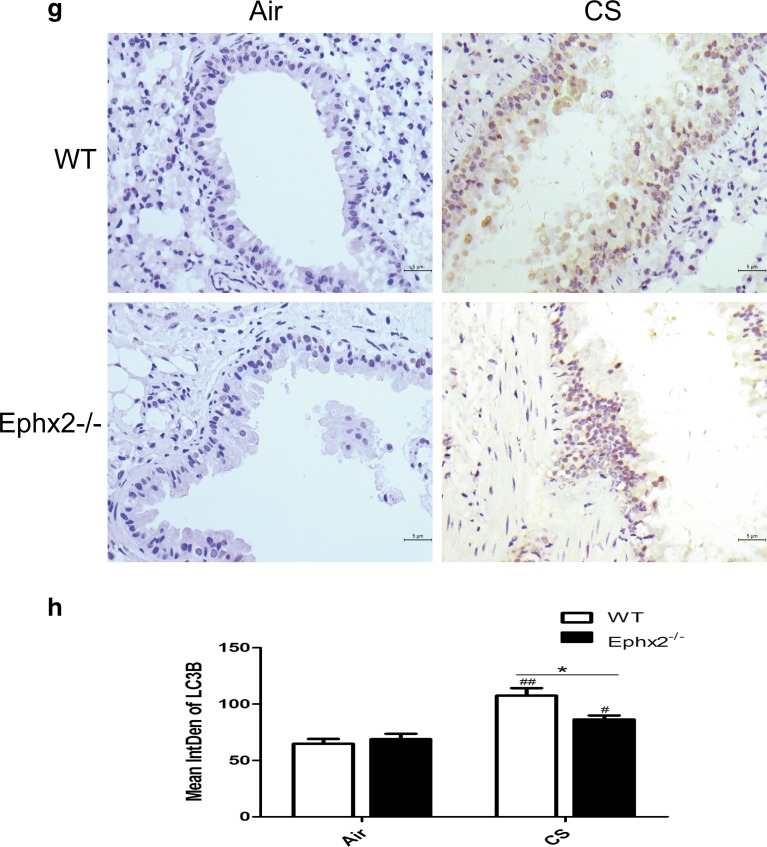
Ephx2−/− mice had less autophagy in response to CS-WT and Ephx2−/− mice were exposed to air or CS for 12 weeks and autophagy protein LC3B and Beclin 1 expression was measured. a Autophagosomes under electron microscopy (×100,000); white arrows depict autophagosomes (n = 3 mice/group). b EM images scored autophagosomes. Data are expressed as AVs/100 μm2 (N = 10 images representative of each group). c Western blot of Beclin 1. d Relative intensity of Beclin 1 was calculated by densitometry and values are presented as means ± SD. e–h Representative immunohistochemical images for Beclin 1 (e) and LC3B (g) in mouse lung tissues (n = 3 mice/group). f, h Graph represents IntDen of Beclin 1 and LC3B and values are presented as means ± SD. # P < 0.05, significant difference from corresponding air-exposed mice; ## P < 0.01, significant difference from corresponding air-exposed mice. * P < 0.05, significant difference between CS-exposed WT mice and CS-exposed Ephx2−/− mice.


