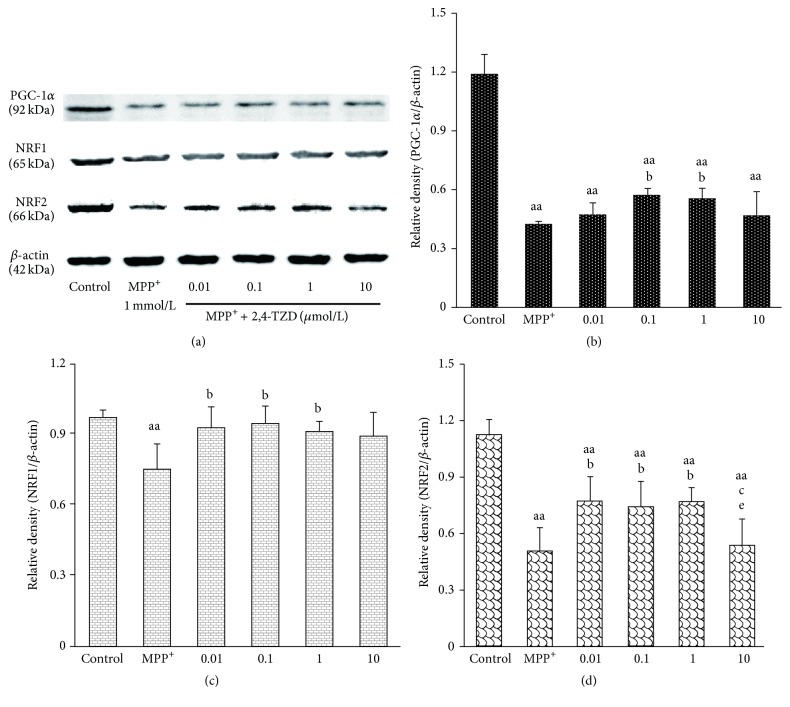
Figure 5.
Effect of thiazolidinedione on PGC-1α, NRF1, and NRF2 protein levels. (a) The expression of PGC-1α, NRF1, and NRF2 in different groups; β-actin was used as the loading control. ((b)–(d)) PGC-1α, NRF1, and NRF2 protein levels. “aa” indicates P < 0.01, compared with control group; “b” indicates P < 0.05, compared with MPP+ group; “c” indicates P < 0.05, compared with 0.01 μmol/L 2,4-TZD group; “e” indicates P < 0.05, compared with 1 μmol/L 2,4-TZD group.

