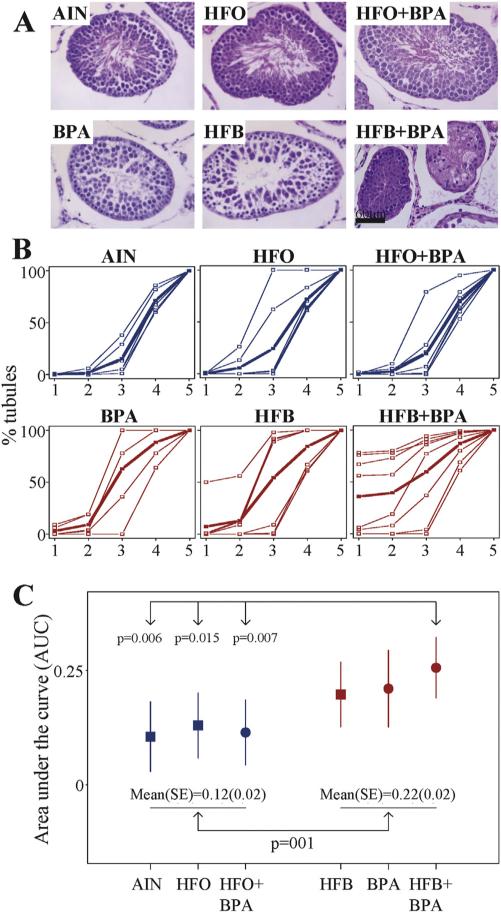
Fig. 2.
Impaired spermatogenesis in testis of male offspring exposed to various diets in the T + E2 rodent model. (A) Representative tubules illustrating the impaired phenotype observed for each diet group. Offspring prenatally exposed to control AIN diet show all steps of spermatogenesis culminating in spermatozoa. BPA- and HFB-exposed offspring show impaired spermatogenesis, with the last step predominantly consisting of round and elongating spermatids. The HFB + BPA-exposed offspring also show impaired spermatogenesis with atrophic (spermatogonia) tubules. The HFO− and HFO + BPA-exposed offspring show essentially normal spermatogenesis. Bar = 60 μm. (B) Plot of tubules showing cumulative progression of spermatogenesis. STs were scored for spermatogenesis, showing (1) spermatogonia/atrophic tubules (2) spermatocytes (3) round spermatids (4) elongated and condensed spermatids and (5) spermatozoa; as the last differentiated germ cell present within the tubules. Blue and red colored curves are progression of spermatogenesis per subject. The bold curve represents an average among individuals in each group. (C) Comparison of areas under the curve (AUC) as a measure of spermatogenesis among Groups. A solid square and its whiskers represent a mean (95% CI) of AUC in groups without BPA and a solid cycle and its whiskers represent a mean (95% CI) in groups with BPA. The mean of the HFB + BPA group is significantly higher than the AIN, HFO and HFO + BPA groups (* = P<0.05).

