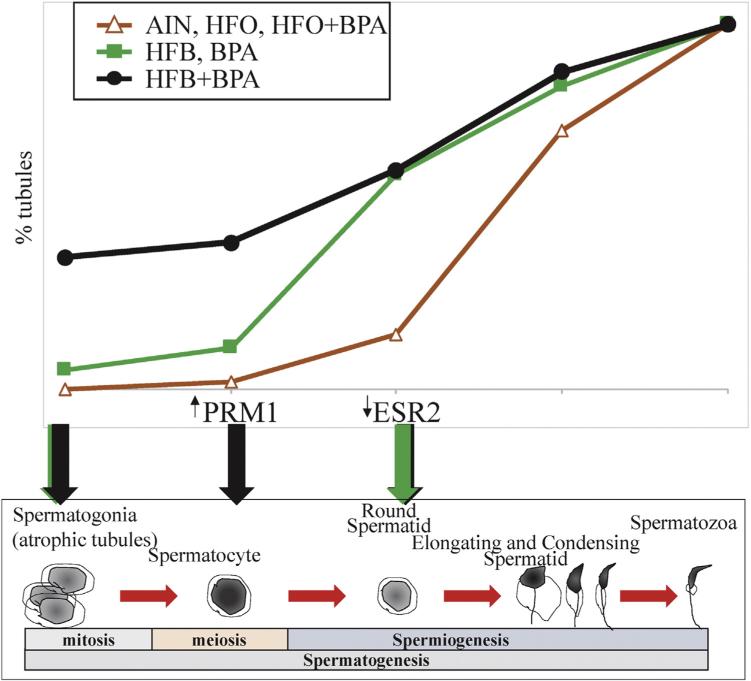
Fig. 6.
Cartoon representing germ cell development in testis and the plot of spermatogenesis. Green arrows (BPA or HFB), and black arrows (BPA + HFB) represent steps where exposure appears to interfere with spermatogenesis and spermiogenesis progression. (For interpretation of the references to colour in this figure legend, the reader is referred to the web version of this article.)

