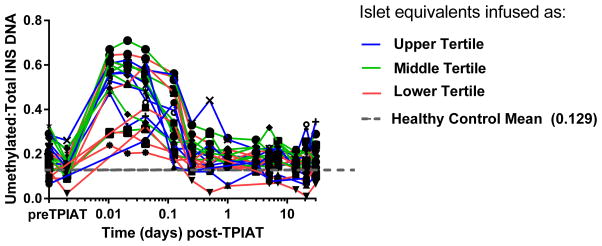
Figure 2.
Trajectory of unmethylated INS DNA ratio post-TPIAT, with all patients showing elevation of this ratio in the first day post-TPIAT infusion and variable elevations late after transplant and at the day 90 follow up assessment. In this graphic, the first two measures indicate pre-pancreatectory baseline and values in the pancreatectomized patient just prior to islet transplant; subsequent measures were obtained after infusing the islet product. The grey hash line indicated the mean for healthy non-diabetic controls without pancreatitis for reference; while the color lines indicate islet mass transplanted divided into tertiles with blue line indicating the highest tertile (452,500- 624,800 IEQ), green line middle tertile (301,000- 409,600 IEQ) and the red line the lowest tertile (111,700- 292,300 IEQ).

