
FIGURE 4.
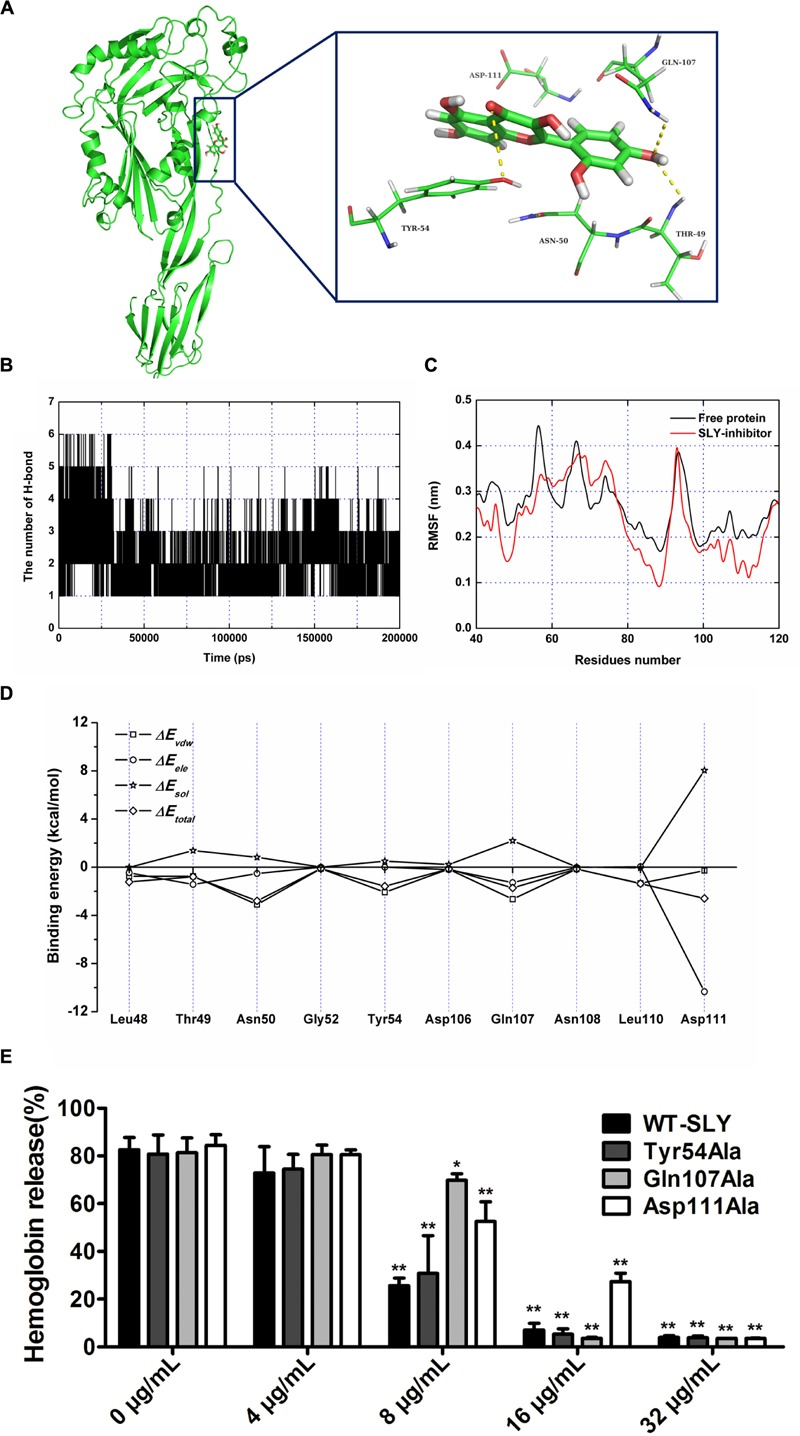
The binding mode of morin with SLY based on the MD simulation. (A) The 3D structure and residues of the binding site in the SLY-morin complex; (B) RMSF of the residue positions over the 200-ns simulations with respect to their initial position in SLY as a free protein and in complex; (C) The number of hydrogen bonds between morin and SLY during the MD simulation; (D) Decomposition of the binding energy on a per-residue basis in the binding sites of the SLY-morin complex; (E) The effect of morin on the hemolylsis induced by SLY and its derivatives, Tyr54Ala, Gln107Ala, and Asp111. ∗ indicates P < 0.05, and ∗∗ indicates P < 0.01 compared with the morin-free sample (two-tailed Student’s t-test).