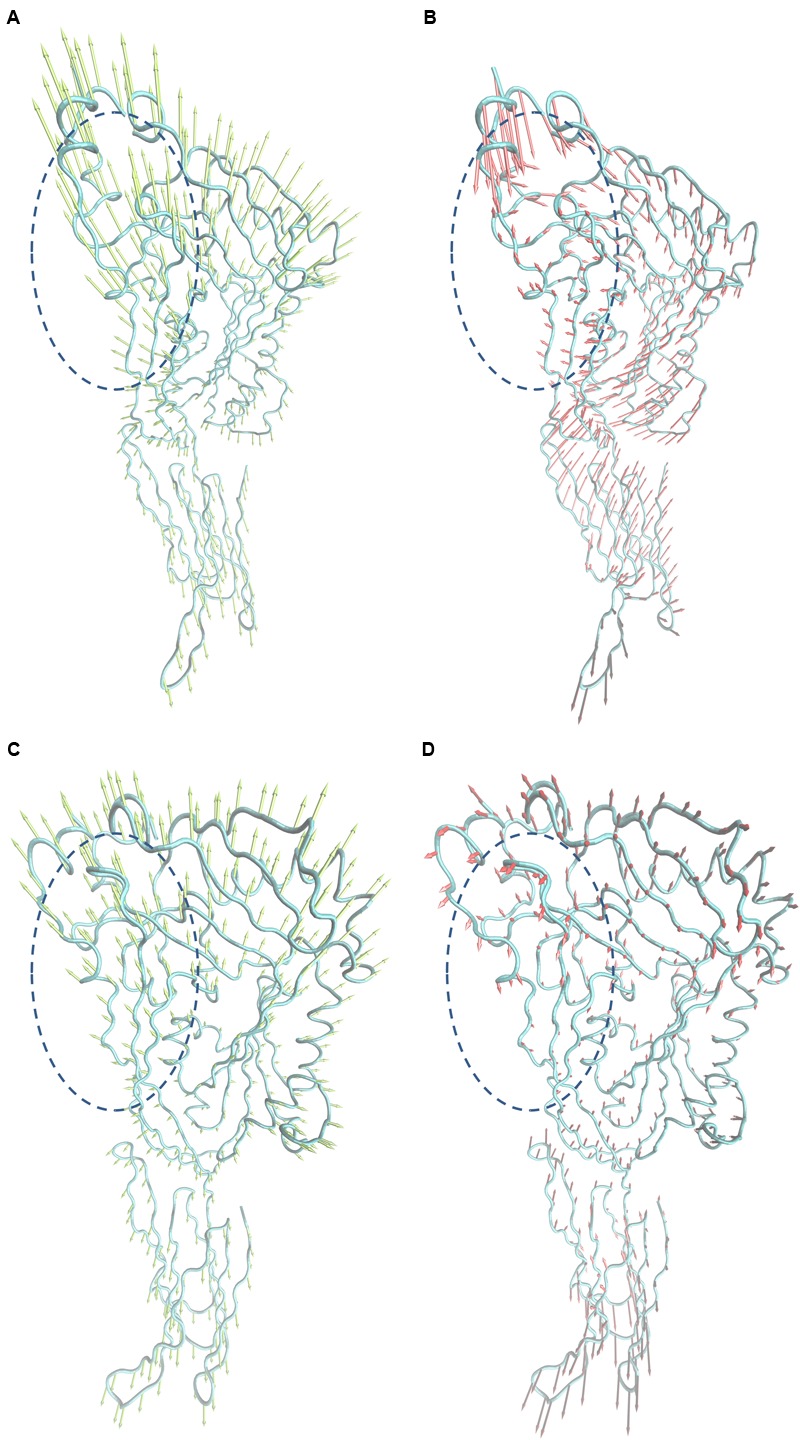
FIGURE 5.

Collective motions obtained by principal component analysis on the simulation trajectory. (A) and (B) Motions corresponding to PC1 and PC2 of the free SLY. (C,D) Motions corresponding to PC1 and PC2 of the SLY-morin complex.

Collective motions obtained by principal component analysis on the simulation trajectory. (A) and (B) Motions corresponding to PC1 and PC2 of the free SLY. (C,D) Motions corresponding to PC1 and PC2 of the SLY-morin complex.