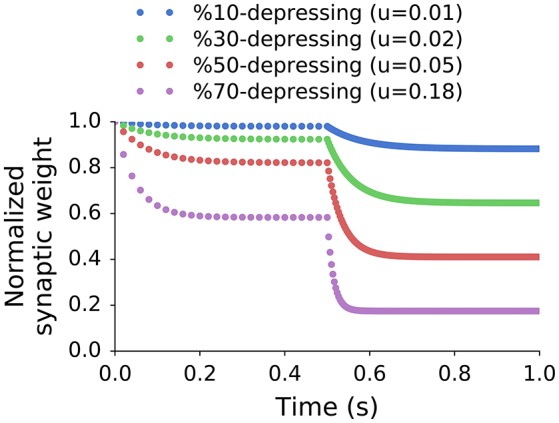
Figure 2.

Normalized peak synaptic weights of single exponential recovery synapses stimulated at two different frequencies. The stimulation in the first interval (0–0.5 s) was 50 Hz (approximately SR of the input), and 300 Hz (approximately max rate of input) in the second one (0.5–1 s). The steady states in each interval (sf) were used to calculate the effective depression level (X%) using Equation (3). All synapses share the same recovery time constant but have different values of u.
