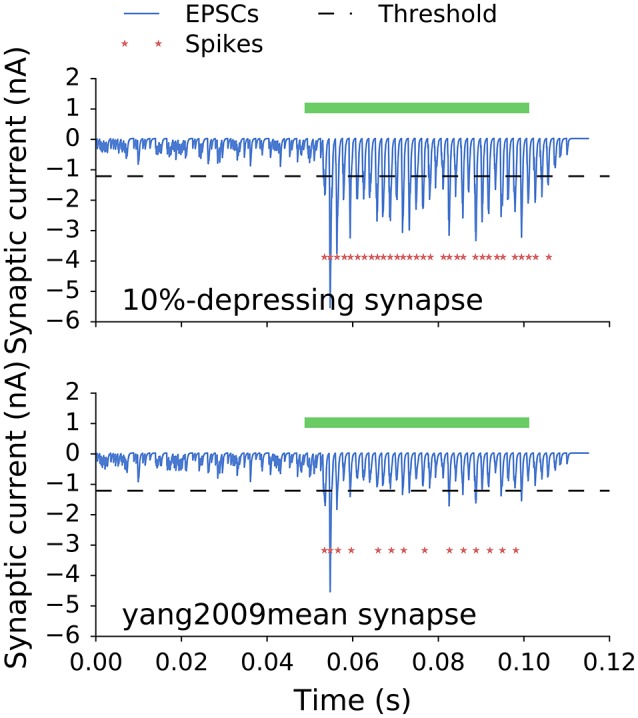
Figure 5.

Postsynaptic currents of two GBCs with 10%-depressing and yang2009mean synapses stimulated with a 50 ms pure tone of 650 Hz (green bar). The dashed line is plotted for reference and indicates a threshold for a single EPSC to initiate an action potential. Red stars indicate action potentials triggered by the stimulation. The less depressing synapses (10%-depressing) produced more action potentials than the more depressing synapses (yang2009mean, Table 1). The SR for both cells was 7.5 spikes/s.
