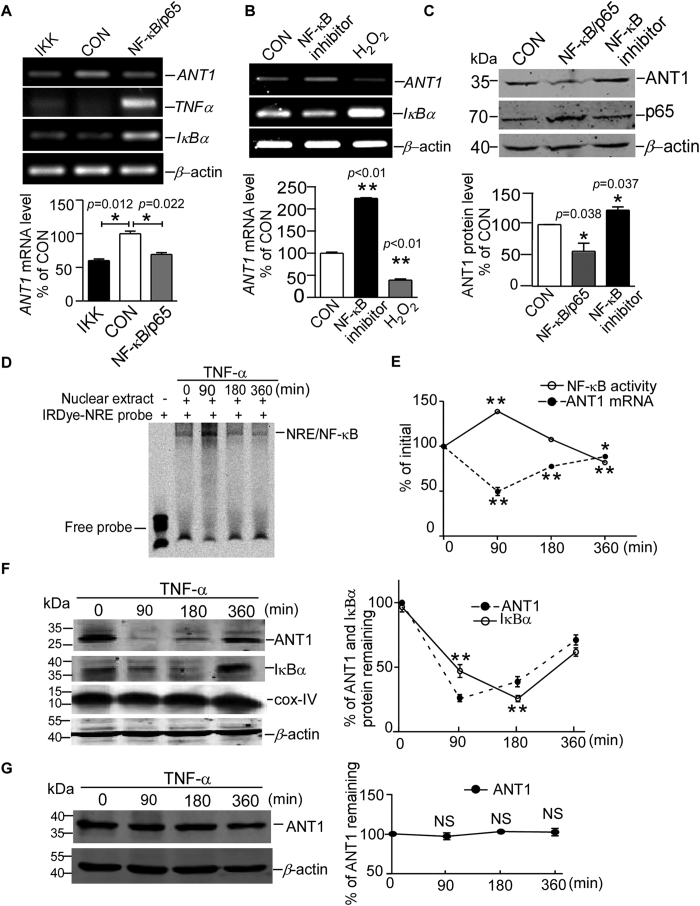
Figure 1. NF-κB represses ANT1 gene transcription and protein expression.
(A) RT-PCR shows the ANT1, TNFα, and IκBα mRNA expression in HEK 293 cells after 24 hours transfection with IKKβ and NF-κB/p65. The histogram depicts the mean ratios of ANT1 mRNA to β-actin ± SEM (n = 3); *p < 0.05, Student’s t test. (B) ANT1 and IκBα mRNA expression in HEK293 were examined in the presence of NF-κB activity inhibitor JSH-23 (15 μM) and the NF-κB activator H2O2 (50 μM Values represent means ± SEM (n = 3); **p < 0.01, Student’s t test. (C) The endogenous ANT1 protein in HEK293 was affected by NF-κB/p65 transfection and NF-κB inhibitor JSH-23 (15 μM). Cropped blots were displayed. Anti-ANT1 (ab110322, Abcam) and anti-NF-κB/p65 (#8242, CST) antibodies were used in WB. β-actin was used as loading controls. Values represent means ± SEM (n = 3); *p < 0.05, Student’s t test. (D) The IRDye 800-labelled consensus NRE oligo was used as probes in EMSA. Nuclear extracts in EMSA were extracted from T98G cells treated with TNFα (10 ng/ml) for 0, 90, 180 and 360 minutes. NRE, NF-κB responsive elements (E) ANT1 mRNA levels and NF-κB activities in TNFα (10 ng/ml) induced T98G cells for 0, 90, 180 and 360 minutes were depicted in line graph; *p < 0.05, **p < 0.01, One-way ANOVA test, as compared with initial time point. (F) T98G cells stimulated by TNFα (10 ng/ml) for 0, 90, 180 and 360 minutes were harvested and lysed for WB of endogenous ANT1, IκBα and COX-IV. Anti-ANT1 (ab110322; Abcam), anti-IκBα (#4814, CST) and anti-COX-IV (#4850, CST) antibodies were used in WB. β-actin was used as a loading control. Cropped blots were displayed. Values represent means ± SEM (n = 3); **p < 0.01, One-way ANOVA test, as compared with initial time point. (G) ANT1 over-expression plasmid (p3xflagANT1) was transfected into T98G cells and stimulated by TNFα for 0, 90, 180 and 360 minutes. Anti-flag (M2, F1804, Sigma-Aldrich) was used to detect exogenous ANT1 expression. Cropped blots were displayed. Values represent means ± SEM (n = 3); NS, no significant difference, One-way ANOVA test, as compared with initial time point.

