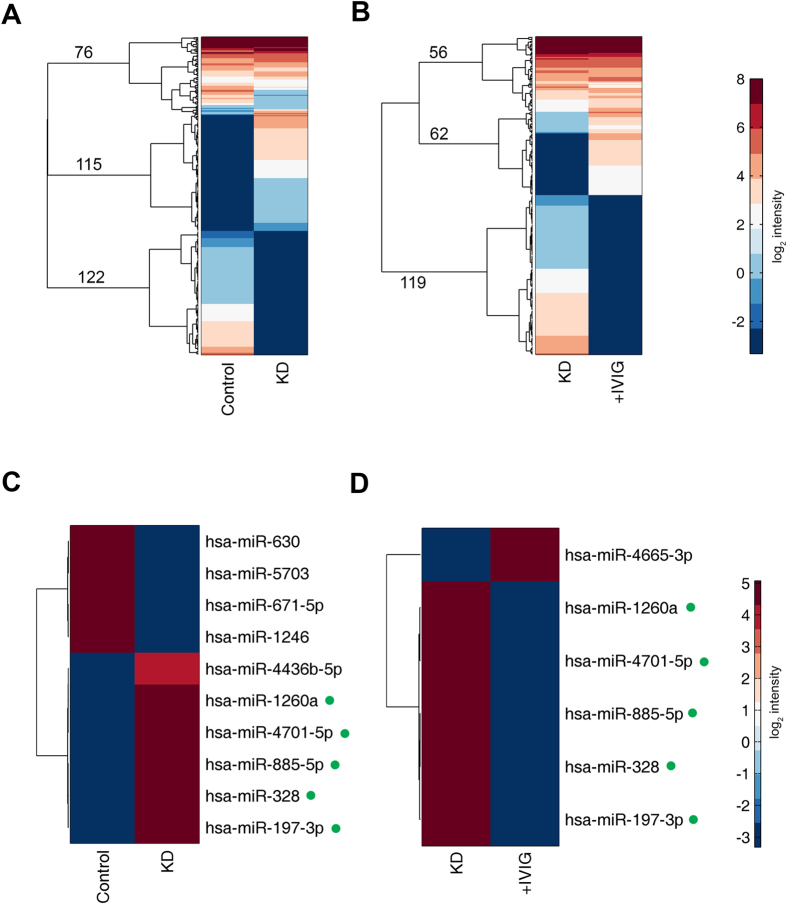
Figure 2. Microarray detection of exosome miRNA.
(A,B) Clustergram of miRNA signal intensities of data from healthy controls versus data from Kawasaki disease patients (A); and of data from Kawasaki disease patients versus data from Kawasaki disease patients who underwent immunoglobulin treatment (B). miRNA for whose Log2 intensity <−3 (darkest blue in the colour scale) were considered undetected. Clustering was performed using Euclidean distances and Ward’s linkage. The numbers represent the number of miRNAs in each main branch among the top three branches of the dendrogram. (C,D) Selected miRNAs from (A,B) who exhibited a difference in expression >200-fold. The five miRNAs with green dots after their names were exhibited a difference in expression >200-fold.

